Thursday, May 31, 2018

Don't Wait to Sell Your House! Buyers Are Out Now

Don’t Wait to Sell Your House! Buyers Are Out Now | Keeping Current Matters
Recently released data from the National Association of Realtors (NAR) suggests that a now is a great time to sell your home. The concept of ‘supply & demand’ reveals that the best price for an item is realized when the supply of that item is low and the demand for that item is high.
Let’s see how this applies to the current residential real estate market.

SUPPLY

It is no secret that the supply of homes for sale has been far below the number needed to sustain a normal market for over a year at this point. A normal market requires six months of housing inventory to meet the demand. The latest report from NAR revealed that there is currently only a 3.6-month supply of houses on the market.

Supply is currently very low!

DEMAND

A report that was just released tells us that demand is very strong. The most recent Foot Traffic Report (which sheds light on the number of buyers who are actually out looking at homes) disclosed that “foot traffic grew 10.5 points to 52.4 in March as the new season approaches.”

Demand is currently very high!

Bottom Line

Waiting to sell will only increase the competition between you and all of the other sellers putting their houses on the market later this summer. If you are debating whether or not to list your home, contact a local real estate professional who can explain the conditions in your market.

Tuesday, May 29, 2018

Access: An Important Factor in Getting Your House SOLD!

Access: An Important Factor in Getting Your House SOLD! | Keeping Current Matters
So, you’ve decided to sell your house. You’ve hired a real estate professional to help you through the entire process, and they have asked you what level of access you want to provide to your potential buyers.
There are four elements to a quality listing. At the top of the list is Access, followed by Condition, Financing, and Price. There are many levels of access that you can provide to your agent so that he or she can show your home.

Here are five levels of access that you can give to buyers, along with a brief description:

  1. Lockbox on the Door – this allows buyers the ability to see the home as soon as they are aware of the listing, or at their convenience.
  2. Providing a Key to the Home – although the buyer’s agent may need to stop by an office to pick up the key, there is little delay in being able to show the home.
  3. Open Access with a Phone Call – the seller allows showings with just a phone call’s notice.
  4. By Appointment Only (example: 48-Hour Notice) – Many buyers who are relocating for a new career or promotion start working in that area prior to purchasing their home. They often like to take advantage of free time during business hours (such as their lunch break) to view potential homes. Because of this, they may not be able to plan their availability far in advance or may be unable to wait 48 hours to see the house.
  5. Limited Access (example: the home is only available on Mondays or Tuesdays at 2pm or for only a couple of hours a day) – This is the most difficult way to be able to show your house to potential buyers.
With May proving to be the best month to sell your home, access can make or break your ability to get the price you are looking for, or even sell your house at all.

Friday, May 25, 2018

3 Tips for Making Your Dream of Owning a Home a Reality [INFOGRAPHIC]

3 Tips for Making Your Dream of Owning a Home a Reality [INFOGRAPHIC] | Keeping Current Matters

Some Highlights:

  • Setting up an automatic savings plan that saves a small amount of every check is one of the best ways to save without thinking much about it.
  • Living within a budget right now will help you save money for down payments while also paying down other debts that might be holding you back.
  • What are you willing to cut back on to make your dreams of homeownership a reality?

Thursday, May 24, 2018

5 Ways Tax Reform Has Impacted the 2018 Housing Market

5 Ways Tax Reform Has Impacted the 2018 Housing Market | Keeping Current Matters
Starting late last year, some predicted that the 2018 tax changes would cripple the housing market. Headlines warned of the potential for double-digit price depreciation and suggested that buyer demand could drop like a rock. There was even sentiment that homeownership could lose its coveted status as a major component of the American Dream.
Now that the first quarter numbers are in, we can begin to decipher the actual that impact tax reform has had on the real estate market.

1. Has tax reform killed off home buyer demand? The answer is “NO.”

According to the Showing Time Index which “tracks the average number of buyer showings on active residential properties on a monthly basis” and is a “highly reliable leading indicator of current and future demand trends,” buyer demand has increased each month over the last three months and is HIGHER than it was for the same months last year. Buyer demand is not down. It is up.

2. Have the tax changes affected America’s belief in real estate as a long-term investment? The answer is “NO.”

Two weeks ago, Gallup released its annual survey which asks Americans which asset they believed to be the best long-term investment. The survey revealed:
“More Americans name real estate over several other vehicles for growing wealth as the best long-term investment for the fifth year in a row. Just over a third cite real estate for this, while roughly a quarter name stocks or mutual funds.”
The survey also showed that the percentage of Americans who believe real estate is the best long-term investment was unchanged from a year ago.

3. Has the homeownership rate been negatively impacted by the tax changes? The answer is “NO.”

Not only did the homeownership rate not crash, it increased when compared to the first quarter of last year according to data released by the Census Bureau.
In her latest Z Report,” Ivy Zelman explains that tax reform didn’t hurt the homeownership rate, but instead, enhanced it:
“We have been of the opinion that homeownership is most highly correlated with income and the net effect of tax reform would be a positive, rather than negative catalyst for the homeownership rate. While still in the early innings of tax changes, this has proven to be the case.”

4. Has the upper-end market been crushed by new State and Local Taxes (SALT) limitations? The answer is “NO.”

In the National Association of Realtors latest Existing Home Sales Report it was revealed that:
  • Sales between $500,000 and $750,000 were up 4.5% year-over-year
  • Sales between $750,000 and $1M were up 15.1% year-over-year
  • Sales over $1M were up 17.3% year-over-year

5. Will the reforms in the tax code cause home prices to tumble over the next twelve months? The answer is “NO.”

According to CoreLogic’s latest Home Price Insights Report, home prices will appreciate in each of the 50 states over the next twelve months. Appreciation is projected to be anywhere from 1.9% to 10.3% with the national average being 4.7%.

Bottom Line

The doomsday scenarios that some predicted based on tax reform fears seem to have already blown over based on the early housing industry numbers being reported.

Monday, May 21, 2018

4 Reasons Why Today's Housing Market is NOT 2006 All Over Again

4 Reasons Why Today’s Housing Market is NOT 2006 All Over Again | Keeping Current Matters
With home prices rising again this year, some are concerned that we may be repeating the 2006 housing bubble that caused families so much pain when it collapsed. Today’s market is quite different than the bubble market of twelve years ago. There are four key metrics that explain why:
  1. Home Prices
  2. Mortgage Standards
  3. Mortgage Debt
  4. Housing Affordability

1. HOME PRICES

There is no doubt that home prices have reached 2006 levels in many markets across the country. However, after more than a decade, home prices should be much higher based on inflation alone.
Frank Nothaft is the Chief Economist for CoreLogic (which compiles some of the best data on past, current, and future home prices). Nothaft recently explained:
“Even though CoreLogic’s national home price index got to the same level it was at the prior peak in April of 2006, once you account for inflation over the ensuing 11.5 years, values are still about 18% below where they were.” (emphasis added)

2. MORTGAGE STANDARDS

Some are concerned that banks are once again easing lending standards to a level similar to the one that helped create the last housing bubble. However, there is proof that today’s standards are nowhere near as lenient as they were leading up to the crash.
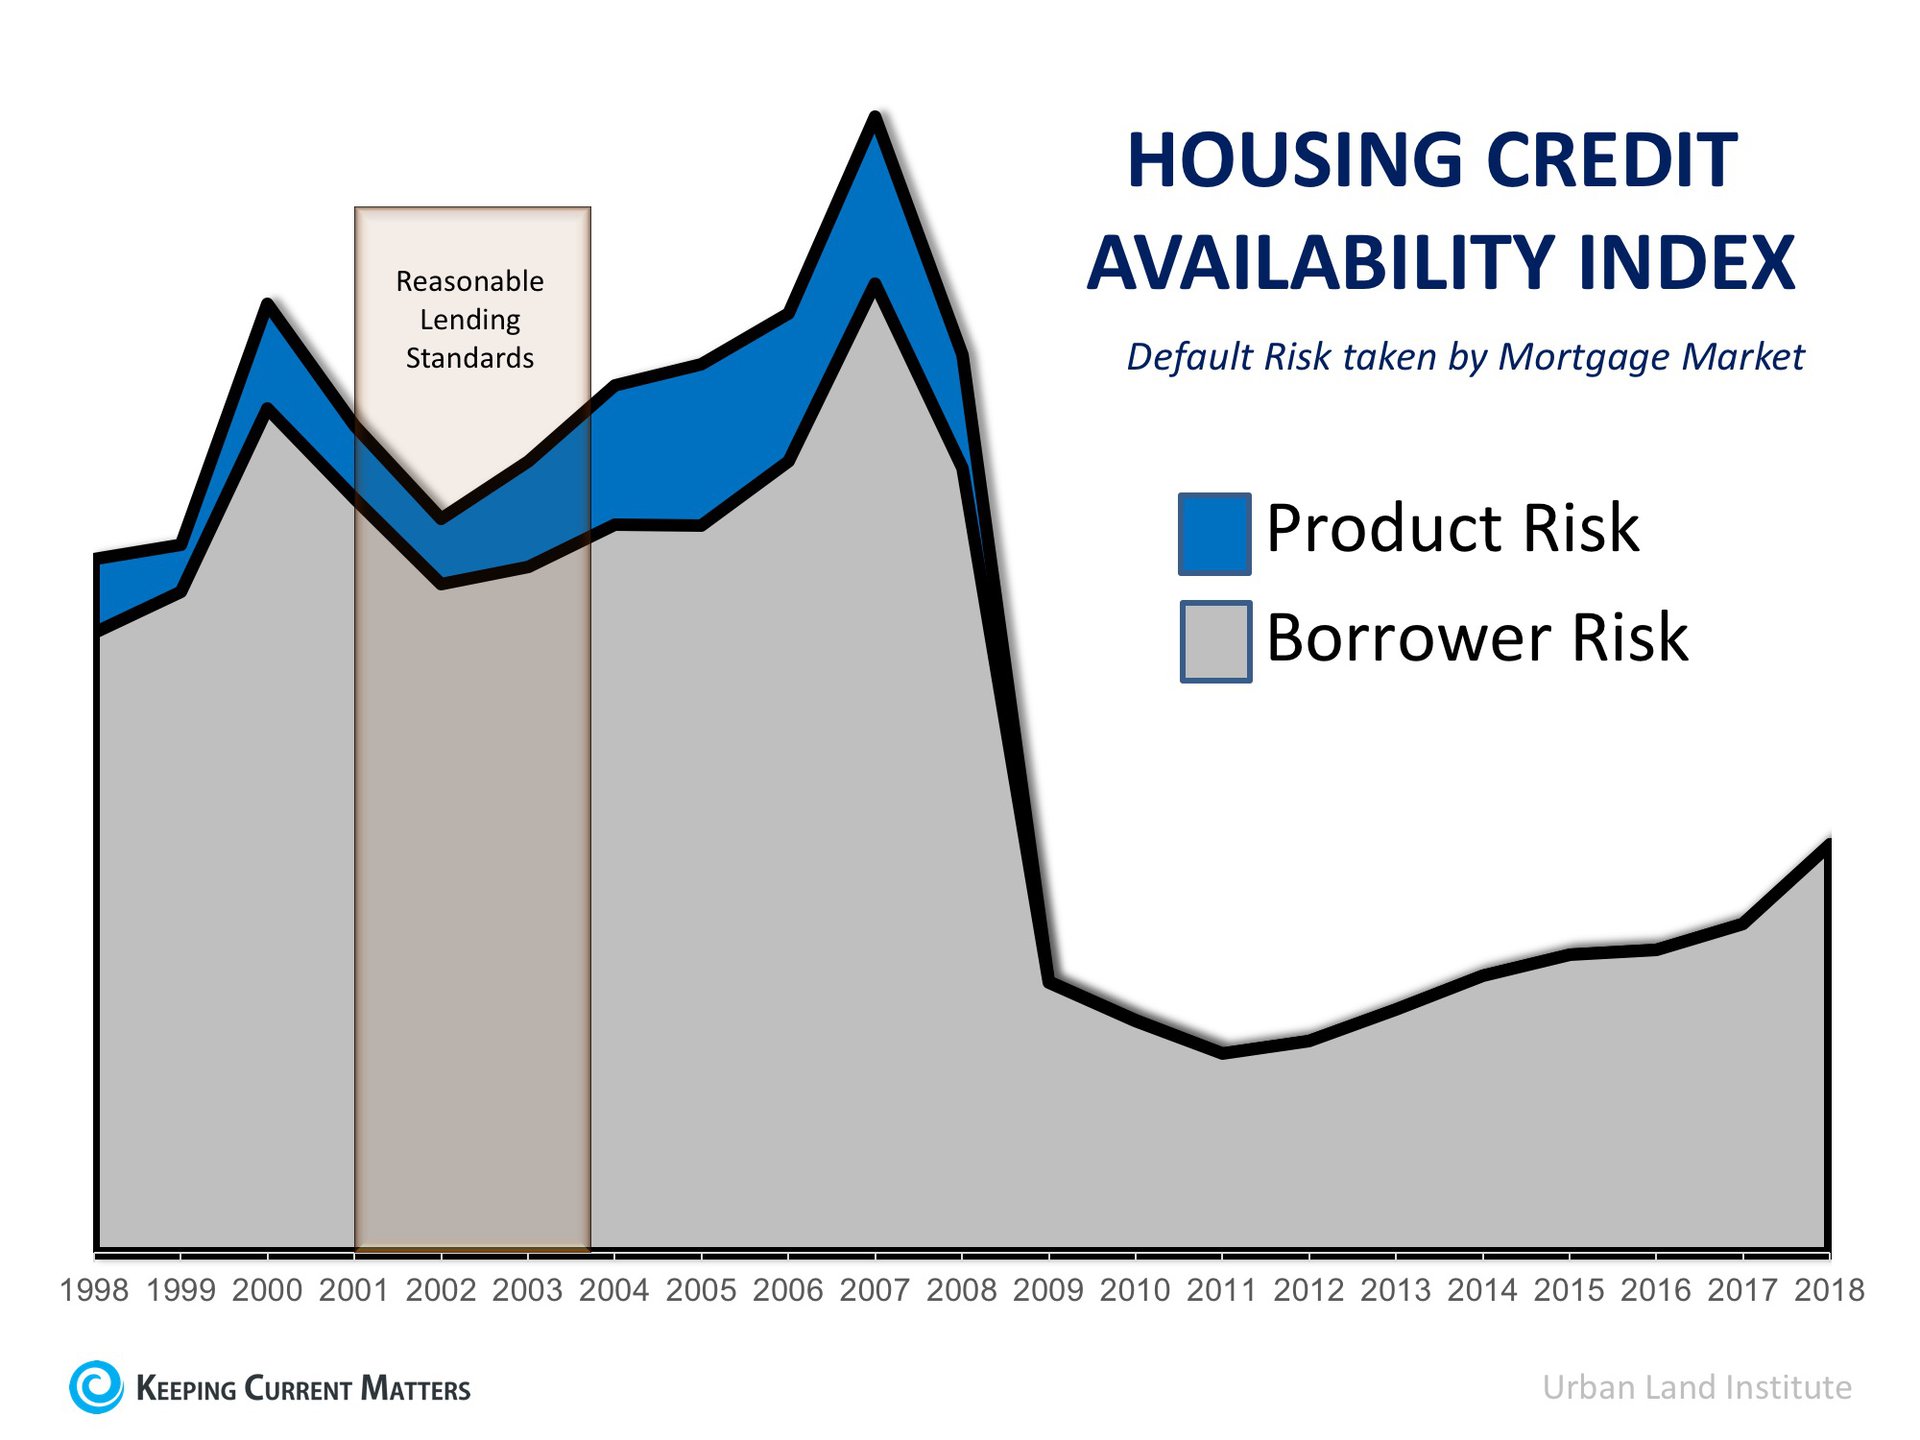
The Urban Institute’s Housing Finance Policy Center issues a Housing Credit Availability Index (HCAI). According to the Urban Institute:
“The HCAI measures the percentage of home purchase loans that are likely to default—that is, go unpaid for more than 90 days past their due date. A lower HCAI indicates that lenders are unwilling to tolerate defaults and are imposing tighter lending standards, making it harder to get a loan. A higher HCAI indicates that lenders are willing to tolerate defaults and are taking more risks, making it easier to get a loan.”
The graph below reveals that standards today are much tighter on a borrower’s credit situation and have all but eliminated the riskiest loan products.
4 Reasons Why Today’s Housing Market is NOT 2006 All Over Again | Keeping Current Matters

3. MORTGAGE DEBT

Back in 2006, many homeowners mistakenly used their homes as ATMs by withdrawing their equity and spending it with no concern for the ramifications. They overloaded themselves with mortgage debt that they couldn’t (or wouldn’t) repay when prices crashed. That is not occurring today.
The best indicator of mortgage debt is the Federal Reserve Board’s household Debt Service Ratio for mortgages, which calculates mortgage debt as a percentage of disposable personal income.
At the height of the bubble market a decade ago, the ratio stood at 7.21%. That meant over 7% of disposable personal income was being spent on mortgage payments. Today, the ratio stands at 4.48% – the lowest level in 38 years!

4. HOUSING AFFORDABILITY

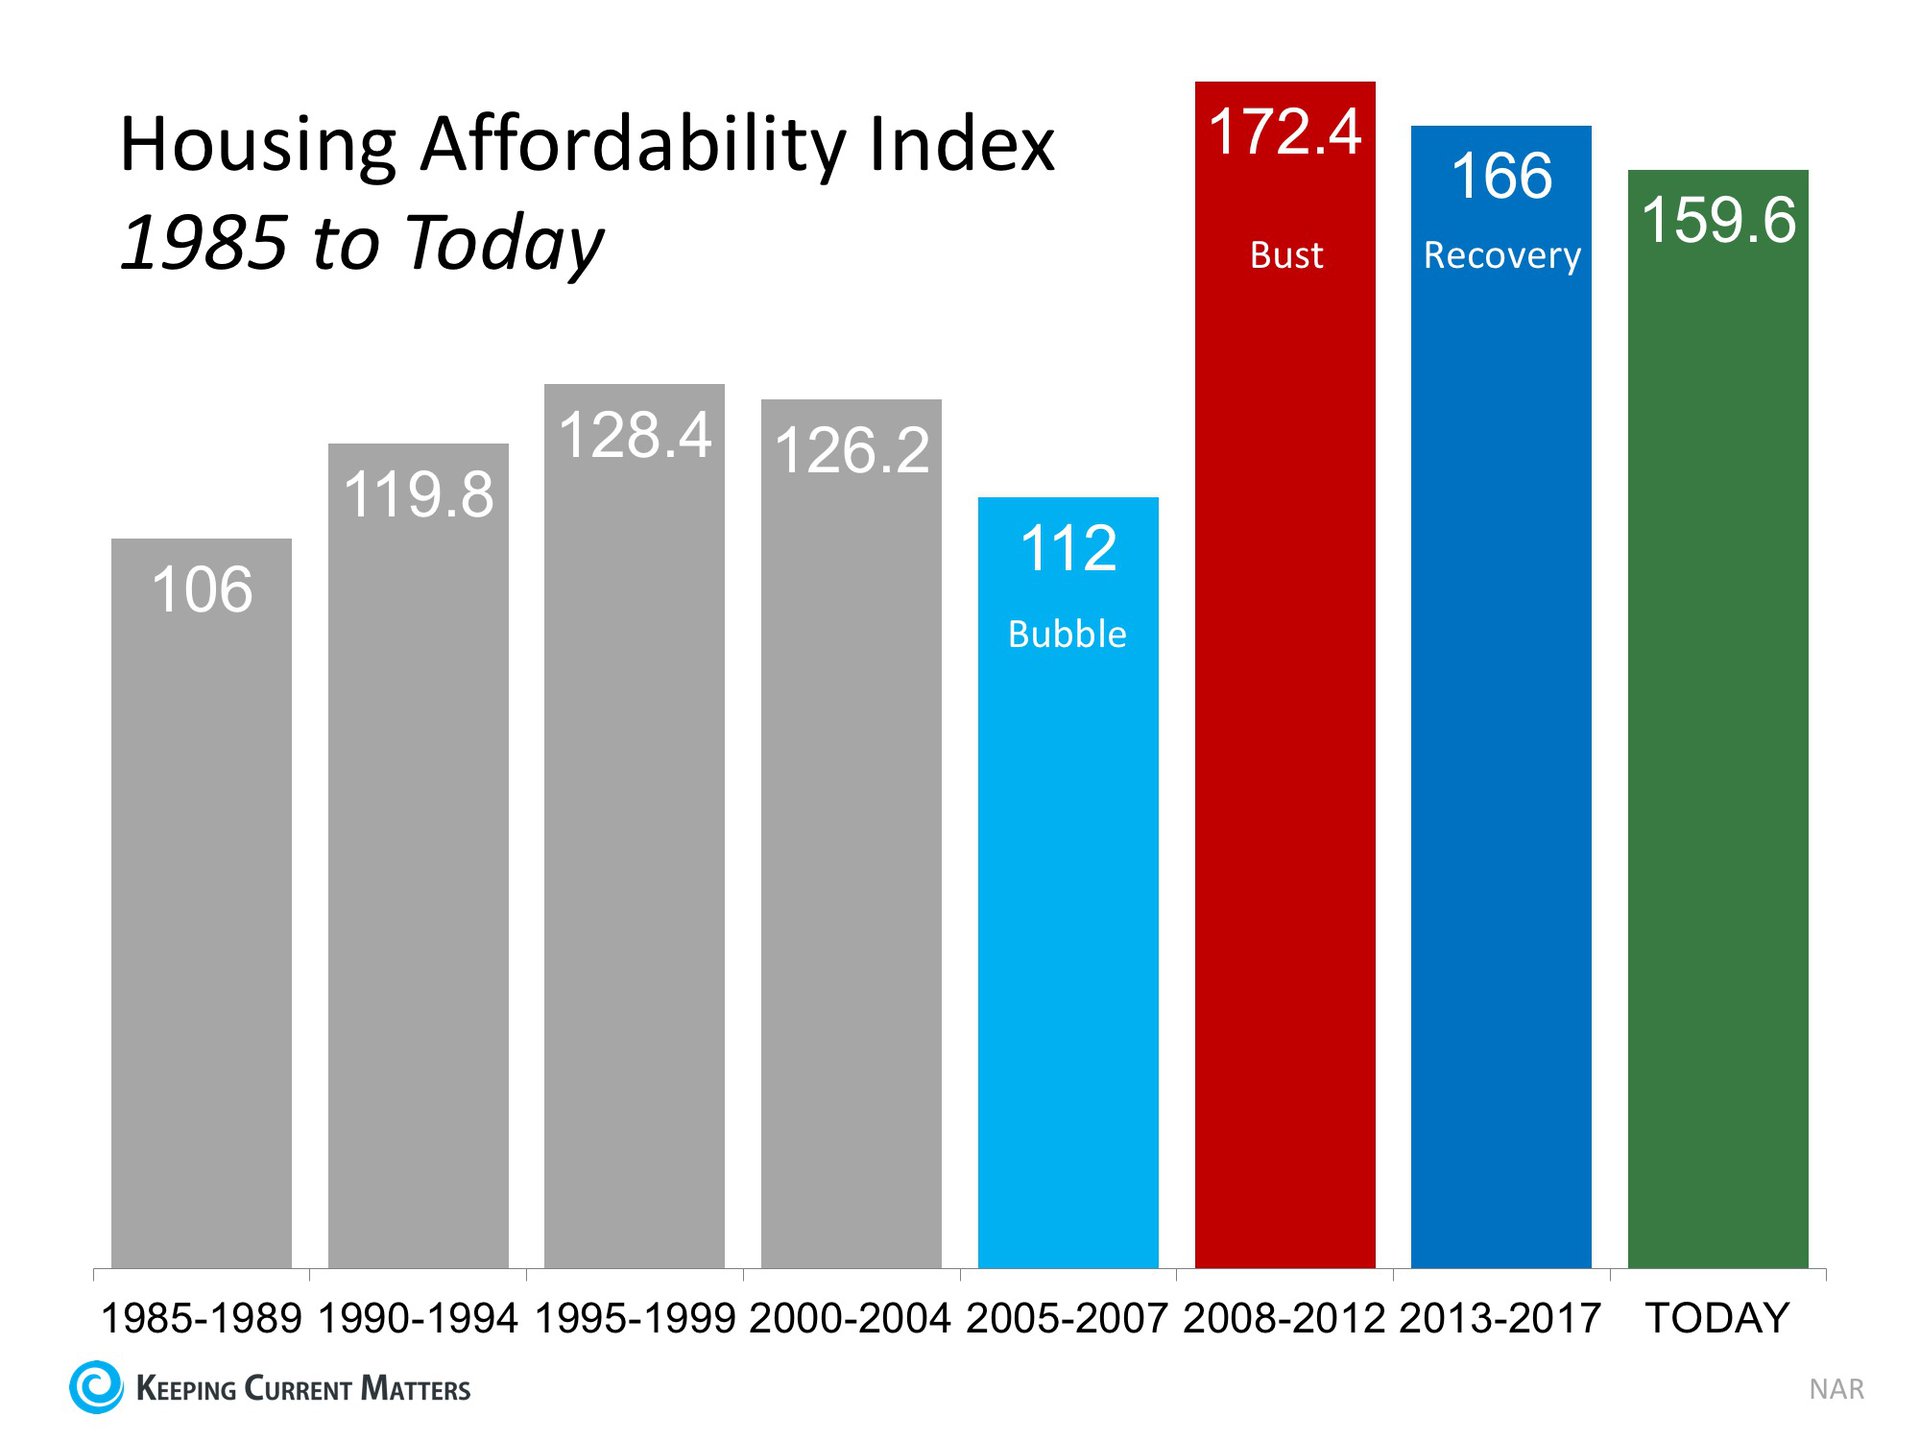
With both house prices and mortgage rates on the rise, there is concern that many buyers may no longer be able to afford a home. However, when we look at the Housing Affordability Index released by the National Association of Realtors, homes are more affordable now than at any other time since 1985 (except for when prices crashed after the bubble popped in 2008).
4 Reasons Why Today’s Housing Market is NOT 2006 All Over Again | Keeping Current Matters

Bottom Line

After using four key housing metrics to compare today to 2006, we can see that the current market is not anything like the bubble market.


Thursday, May 17, 2018

How Much Has Your Home Increased in Value Over the Last Year?

How Much Has Your Home Increased in Value Over the Last Year? | Keeping Current Matters
Home values have risen dramatically over the last twelve months. In CoreLogic’s most recent Home Price Index Report, they revealed that national home prices have increased by 6.7% year-over-year.
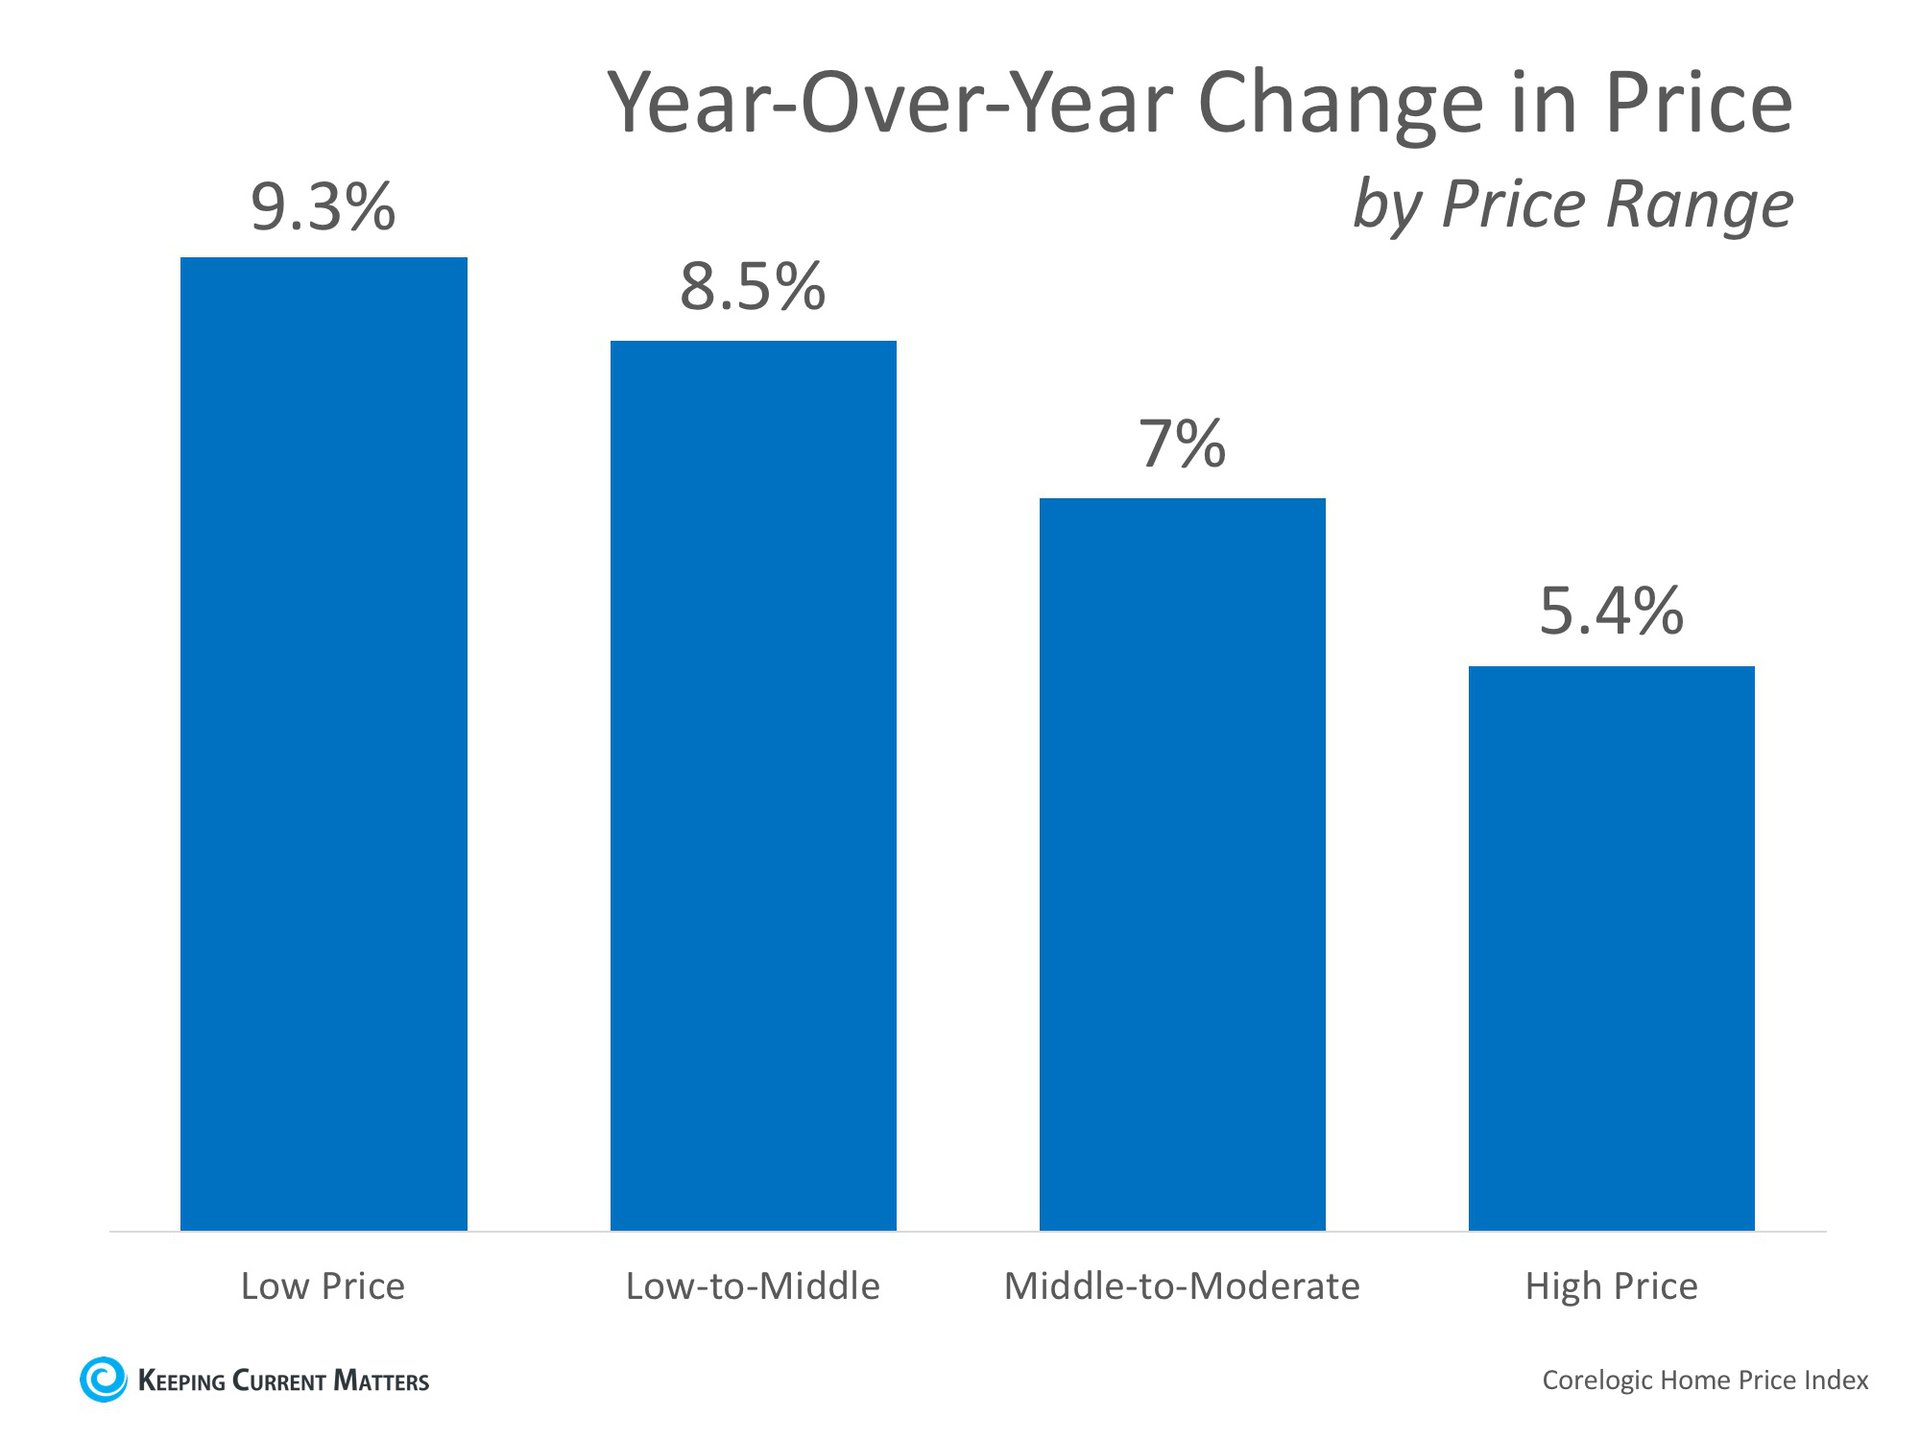
CoreLogic broke down appreciation even further into four price ranges, giving us a more detailed view than if we had simply looked at the year-over-year increases in national median home price.
The chart below shows the four price ranges from the report, as well as each one’s year-over-year growth from February 2017 to February 2018 (the latest data available).
How Much Has Your Home Increased in Value Over the Last Year? | Keeping Current Matters
It is important to pay attention to how prices are changing in your local market. The location of your home is not the only factor that determines how much your home has appreciated over the course of the last year.
Lower-priced homes have appreciated at greater rates than homes at the upper ends of the spectrum due to demand from first-time home buyers and baby boomers looking to downsize.

Bottom Line

If you are planning to list your home for sale in today’s market, find a local agent who can explain exactly what’s going on in your area and your price range

Monday, May 14, 2018

50% of Homes Sold in 30 Days in March [INFOGRAPHIC]

50% of Homes Sold in 30 days in March [INFOGRAPHIC] | Keeping Current Matters

Some Highlights:

  • The National Association of REALTORS® recently surveyed their members for their Confidence Index.
  • The REALTORS® Confidence Index is a key indicator of housing market strength based on a monthly survey sent to over 50,000 real estate practitioners. Practitioners are asked about their expectations for home sales, prices and market conditions.
  • Homes sold in less than 60 days in 35 out of 50 states and Washington D.C.
  • Homes typically went under contract in 30 days in March!