Wednesday, November 28, 2018

2 Myths Holding Back Home Buyers

2 Myths Holding Back Home Buyers | Keeping Current Matters
Urban Institute recently released a report entitled, “Barriers to Accessing Homeownership: Down Payment, Credit, and Affordability,” which revealed that,
“Consumers often think they need to put more money down to purchase a home than is actually required. In a 2017 survey, 68% of renters cited saving for a down payment as an obstacle to homeownership. Thirty-nine percent of renters believe that more than 20% is needed for a down payment and many renters are unaware of low–down payment programs.”

Myth #1: “I Need a 20% Down Payment”

Buyers often overestimate the down payment funds needed to qualify for a home loan. According to the same report:
“Most potential homebuyers are largely unaware that there are low-down payment and no-down payment assistance programs available at the local, state, and federal levels to help eligible borrowers secure an affordable down payment.”  
These numbers do not differ much between non-owners and homeowners. For example, “30% of homeowners and 39% of renters believe that you need more than 20 percent for a down payment.”
While many believe that they need at least 20% down to buy their dream homes, they do not realize that there are programs available which allow them to put down as little as 3%. Many renters may actually be able to enter the housing market sooner than they ever imagined with programs that have emerged allowing less cash out of pocket.

Myth #2: “I Need a 780 FICO® Score or Higher to Buy”

Similar to the down payment, many either don’t know or are misinformed about what FICO® score is necessary to qualify.
Many Americans believe a ‘good’ credit score is 780 or higher.
To help debunk this myth, let’s take a look at Ellie Mae’s latest Origination Insight Report, which focuses on recently closed (approved) loans.
2 Myths Holding Back Home Buyers | Keeping Current Matters
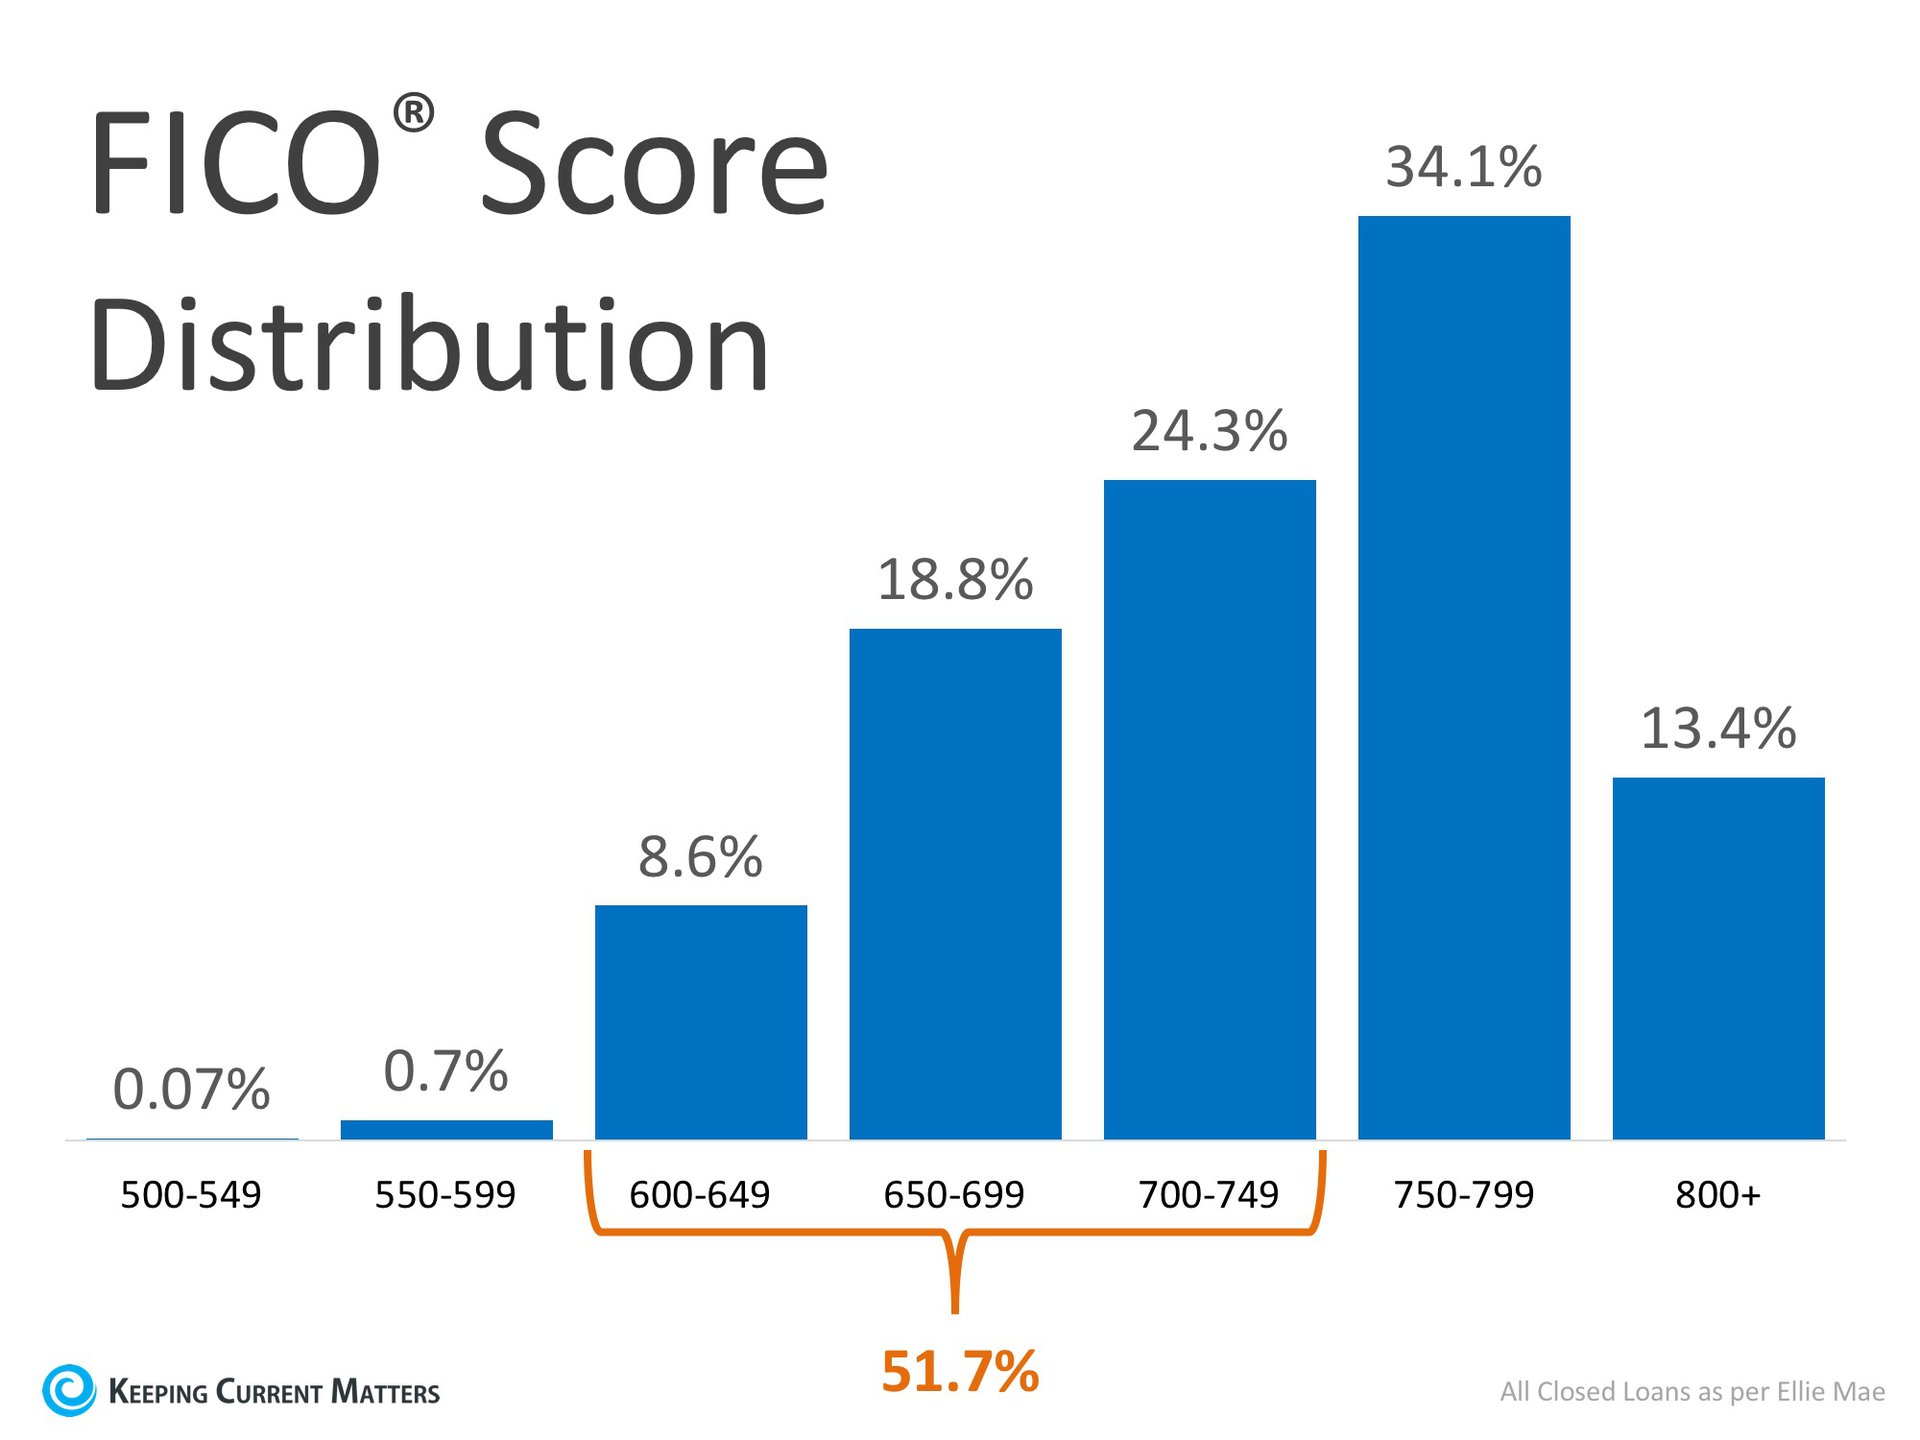
As you can see in the chart above, 51.7% of approved mortgages had a credit score of 600-749.

Bottom Line

Whether buying your first home or moving up to your dream home, knowing your options will make the mortgage process easier. Your dream home may already be within your reach.

Monday, November 26, 2018

Wage Increases Make Home Buying More Affordable


Wage Increases Make Home Buying More Affordable | Keeping Current Matters
Everyone knows that housing affordability has been negatively impacted by rising prices and increasing mortgage rates, but there is another piece to the affordability equation – wages.
How much a family earns obviously impacts how easy or difficult it is for them to afford to own a home. Because of an improving economy, wages are finally beginning to increase – and that dramatically affects home affordability.
According to the National Association of Realtors’ (NAR) September 2018 Housing Affordability Index, wages have increased in every region of the country:
Wage Increases Make Home Buying More Affordable | Keeping Current Matters
After applying current salaries, home prices, and mortgage rates to their Home Affordability Index equation, the index, though still lower than this time last year (160.1 to 146.7), increased over the last month (141.2 to 146.7). For the complete methodology used by NAR,click here.
The percentage of income needed to own a home has also decreased each of the last three months. It currently sits at 17% which is substantially lower than historic numbers.
Wage Increases Make Home Buying More Affordable | Keeping Current Matters

Bottom Line

If you are a first-time buyer or a move-up buyer who believes that purchasing a home is not within your budget, check with a local real estate professional to find out if that is still true.

Wednesday, November 21, 2018

How Will Home Sales Measure Up Next Year?

How Will Home Sales Measure Up Next Year? | Keeping Current Matters
There are many questions about where home sales are headed next year. We have gathered the most reliable sources to help answer this question. Here are our sources:
Mortgage Bankers Association (MBA) – As the leading advocate for the real estate finance industry, the MBA enables members to successfully deliver fair, sustainable, and responsible real estate financing within ever-changing business environments.
The National Association of Realtors (NAR) – The largest association of real estate professionals in the world.
Freddie Mac – An organization which provides liquidity, stability, and affordability to the U.S. housing market in all economic conditions extending to all communities from coast to coast.
Fannie Mae – A leading source of financing for mortgage lenders, providing access to affordable mortgage financing in all markets.

Here are their projections:

How Will Home Sales Measure Up Next Year? | Keeping Current Matters

Bottom Line

Every source sees home sales growing next year. For more on your neighborhood, contact a local real estate professional.

Monday, November 19, 2018

Is the Increase in Inventory a Bullish or Bearish Sign for Real Estate?

Is the Increase in Inventory a Bullish or Bearish Sign for Real Estate? | Keeping Current Matters
    1. New listings jumped 8% year-over-year nationally, the largest increase since 2013
    2. Total listings in the 45 largest markets are now up 6% on average over last year
This increase in housing inventory has sparked two different reactions. Some are saying this is the first sign of a potential collapse while others are saying it is a welcomed reprieve from the lack of inventory that has stalled the market recently. As Zelman & Associatesreported in a recent ‘Z Report’:
“With the rate of home price appreciation starting to decelerate alongside the uptick in inventory, we expect significant debate whether this is a bullish or bearish sign.”

Is this a sign the market might crash?

There are those who look at the increase in inventory as a sign that we are returning to the market we saw last decade. However, a closer look shows that we are nowhere near the levels of inventory we reached before the crash in 2008.
A normal market would have about 6-months inventory, but the latest Existing Home Sales Report issued by the National Association of Realtors revealed that:
“Unsold inventory is at a 4.3-month supply at the current sales pace up from 4.1 months a year ago.”
A decade ago, prices began to rapidly depreciate in June 2007. At that time, we had a 9.1-month supply (more than double what it is today) and inventory kept rising until it hit a peak of 11.1 months in April of 2008.
With the current levels of buyer demand, any such increase in months supply is highly unlikely. As Danielle Hale, realtor.com’s Chief Economist explains:
 “After years of record-breaking inventory declines, September’s almost flat inventory signals a big change in the real estate market. Would-be buyers who had been waiting for a bigger selection of homes for sale may finally see more listings materialize. But don’t expect the level to jump dramatically.
Plenty of buyers in the market are scooping up homes as soon as they’re listed, which will keep national increases relatively small for the time being.”

What will be the result of the increase in inventory?

The increase in inventory will allow many families who had been unable to find a home to finally become homeowners. Again, we quote from the ‘Z Report’:
“In our view, the short-term narrative will probably be confusing, but more sustainable growth and affordability will likely be the end result.”

Bottom Line

If you are either a first-time or second-time buyer who has given up, check with a local real estate professional to see if new listings have come to the market in your area.

Friday, November 16, 2018

Baby Boomers are Downsizing, Are You Ready to Move?

Baby Boomers are Downsizing, Are You Ready to Move? | Keeping Current Matters
For a while now baby boomers have been blamed for a portion of the housing market’s current lack of housing inventory, but should they really be getting the blame?

Here’s what some of the experts have to say on the subject:

Aaron Terrazas, Senior Economist at Zillow, says that “Boomers are healthier and working longer than previous generations, which means they aren’t yet ready to sell their homes.
According to a study by Realtor.com85% of baby boomers indicated they were not planning to sell their homes.
It is true that baby boomers are healthier and are thus working and living longer, but are they also refusing to sell their homes? 
Last month, Trulia looked at the housing situation of seniors (aged 65+) today compared to that of a decade ago. Trulia’s study revealed that:
Although seniors appear to be delaying downsizing until later in life, as a group, households 65 and over are still downsizing at roughly the same rate as in years past.”
Trulia also explains that, 
5.5% of households 65 and over moved, pretty evenly split between moves to single family (2.7%) and multifamily (2.4%) homes. In 2005these percentages were virtually the same, with 5.5% of senior households moving, including 2.5% into single family and 2.5% into multifamily homes.”

So, if these percentages are the same, what is the challenge?

Recent reports tell us that the older population grew from 3 million in 1900 to 47.8 million in 2017.
In addition, the Census recently revised the numbers from their National Population Projections:
The aging of baby boomers means that within just a couple decades, older people are projected to outnumber children for the first time in U.S. history…By 2035, there will be 78.0 million people 65 years and older compared to 76.7 million under the age of 18.

Bottom Line

If you are a baby boomer who is not sure whether you should downsize or move to a warmer climate (other people are doing it, why not you?), call a local real estate professional who can help you evaluate your options today!

Tuesday, November 13, 2018

Pre-Approval: Your 1st Step in Buying a Home

Pre-Approval: Your 1st Step in Buying a Home | Keeping Current Matters
In many markets across the country, the number of buyers searching for their dream homes outnumbers the number of homes for sale. This has led to a competitive marketplace where buyers often need to stand out. One way to show you are serious about buying your dream home is to get pre-qualified or pre-approved for a mortgage before starting your search.
Even if you are in a market that is not as competitive, understanding your budget will give you the confidence of knowing if your dream home is within your reach.
Freddie Mac lays out the advantages of pre-approval in the ‘My Home’ section of their website:
“It’s highly recommended that you work with your lender to get pre-approved before you begin house hunting. Pre-approval will tell you how much home you can afford and can help you move faster, and with greater confidence, in competitive markets.”
One of the many advantages of working with a local real estate professional is that many have relationships with lenders who will be able to help you through this process. Once you have selected a lender, you will need to fill out their loan application and provide them with important information regarding “your credit, debt, work history, down payment and residential history.”
Freddie Mac describes the ‘4 Cs’ that help determine the amount you will be qualified to borrow:
  1. Capacity: Your current and future ability to make your payments
  2. Capital or cash reserves: The money, savings, and investments you have that can be sold quickly for cash
  3. Collateral: The home, or type of home, that you would like to purchase
  4. Credit: Your history of paying bills and other debts on time
Getting pre-approved is one of many steps that will show home sellers that you are serious about buying, and it often helps speed up the process once your offer has been accepted.

Bottom Line

Many potential homebuyers overestimate the down payment and credit scores necessary to qualify for a mortgage today. If you are ready and willing to buy, you may be pleasantly surprised at your ability to do so.

Friday, November 9, 2018

Dispelling the Myth About Home Affordability

Dispelling the Myth About Home Affordability | Keeping Current Matters
We have all seen the headlines that report that buying a home is less affordable today than it was at any other time in the last ten years, and those headlines are accurate. But, have you ever wondered why the headlines don’t say the last 25 years, the last 20 years, or even the last 11 years?

The reason is that homes were less affordable 25, 20, or even 11 years ago than they are today.

Obviously, buying a home is more expensive now than during the ten years immediately following one of the worst housing crashes in American history.
Over the past decade, the market was flooded with distressed properties (foreclosures and short sales) that were selling at 10-50% discounts. There were so many distressed properties that the prices of non-distressed properties in the same neighborhoods were lowered and mortgage rates were kept low to help the economy.

Low Prices + Low Mortgage Rates = High Affordability

Prices have since recovered and mortgage rates have increased as the economy has gained strength. This has and will continue to impact housing affordability moving forward.
However, let’s give affordability some historical context. The National Association of Realtors (NAR) issues their Affordability Index each month. According to NAR:
“The Monthly Housing Affordability Index measures whether or not a typical family earns enough income to qualify for a mortgage loan on a typical home at the national and regional levels based on the most recent monthly price and income data.”
NAR’s current index stands at 138.8. The index had been higher each of the last ten years, peaking at 197 in 2012 (the higher the index the more affordable houses are).
But, the average index between 1990 and 2007 was just 123 and there were no years with an index above 133. That means that homes are more affordable today than at any time during the eighteen years between 1990 and 2007.

Bottom Line

With home prices continuing to appreciate and mortgage rates increasing, home affordability will likely continue to slide. However, this does not mean that buying a house is not an attainable goal in most markets as it is less expensive today than during the eighteen-year stretch immediately preceding the housing bubble and crash.

Wednesday, November 7, 2018

New Home Sales Up 12.7% From Last Year

According to the latest New Residential Sales Report from the Census Bureau, new construction sales in August were up 3.5% from July and 12.7% from last year! This marks the second consecutive month with double-digit year-over-year growth (12.8% in July).
The report also showed that builders have ramped up construction with an increase in new construction starts and completions. The summer months are often a busy time for builders as they capitalize on the warmer weather to be able to finish projects.
Below is a table showing the change in starts, completions, and sales from last August.
New Home Sales Up 12.7% From Last Year | Keeping Current Matters
Other notable news from the report is that the percentage of new construction sales in the $200-$299k range has continued to break away from the $300-$399k range.
This shows that builders are starting to build lower-priced homes that will help alleviate some of the inventory challenges in the starter and trade-up home categories. The chart below shows the full breakdown.
New Home Sales Up 12.7% From Last Year | Keeping Current Matters

What does this mean for buyers and sellers?

If you are thinking of buying or selling in today’s market, you no doubt have heard that there is a shortage of existing homes for sale which has been driving home prices up across the country. The additional new construction coming to the market could help alleviate this shortage, but we are still not back up to pre-crisis levels.

Monday, November 5, 2018

What's Going On With Home Prices?

What’s Going On With Home Prices? | Keeping Current Matters
According to CoreLogic’s latest Home Price Insights Report, national home prices in August were up 5.5% from August 2017. This marks the first time since June 2016 that home prices did not appreciate by at least 6.0% year-over-year.
CoreLogic’s Chief Economist Frank Nothaft gave some insight into this change,
“The rise in mortgage rates this summer to their highest level in seven years has made it more difficult for potential buyers to afford a home. The slackening in demand is reflected in the slowing of national appreciation, as illustrated in the CoreLogic Home Price Index.  
National appreciation in August was the slowest in nearly two years, and we expect appreciation to slow further in the coming year.”
One of the major factors that has driven prices to accelerate at a pace of between 6-7% over the past two years was the lack of inventory available for sale in many areas of the country. This made houses a prized commodity which forced many buyers into bidding wars and drove prices even higher.
According to the National Association of Realtors’ (NAR) latest Existing Home Sales Report, we are starting to see more inventory come to market over the last few months. This, paired with patient buyers who are willing to wait to find the right homes, is creating a natural environment for price growth to slow.
Historically, prices appreciated at a rate of 3.7% (from 1987-1999). CoreLogic predicts that prices will continue to rise over the next year at a rate of 4.7%.

Bottom Line

As the housing market moves closer to a ‘normal market’ with more inventory for buyers to choose from, home prices will start to appreciate at a more ‘normal’ level, and that’s ok! If you are curious about home prices in your area, talk to a local real estate professional who can show you what’s going on!