Friday, December 28, 2018
Friday, December 21, 2018
No Bubble Here! How New Mortgage Standards Are Helping

Real estate is shifting to a more normal market; the days of national home appreciation topping 6% annually are over and inventories are increasing which is causing bidding wars to almost disappear. Some see these as signs that the market will soon come tumbling down as it did in 2008.
As it becomes easier for buyers to obtain mortgages, many are suggesting that this is definite proof that banks are repeating the same mistakes they made a decade ago. Today, we want to assure everyone that we are not heading to another housing “bubble & bust.”
Each month, the Mortgage Bankers’ Association (MBA) releases a measurement which indicates the availability of mortgage credit known as the Mortgage Credit Availability Index (MCAI). According to the MBA:
“The MCAI provides the only standardized quantitative index that is solely focused on mortgage credit. The MCAI is calculated using several factors related to borrower eligibility (credit score, loan type, loan-to-value ratio, etc.).” *
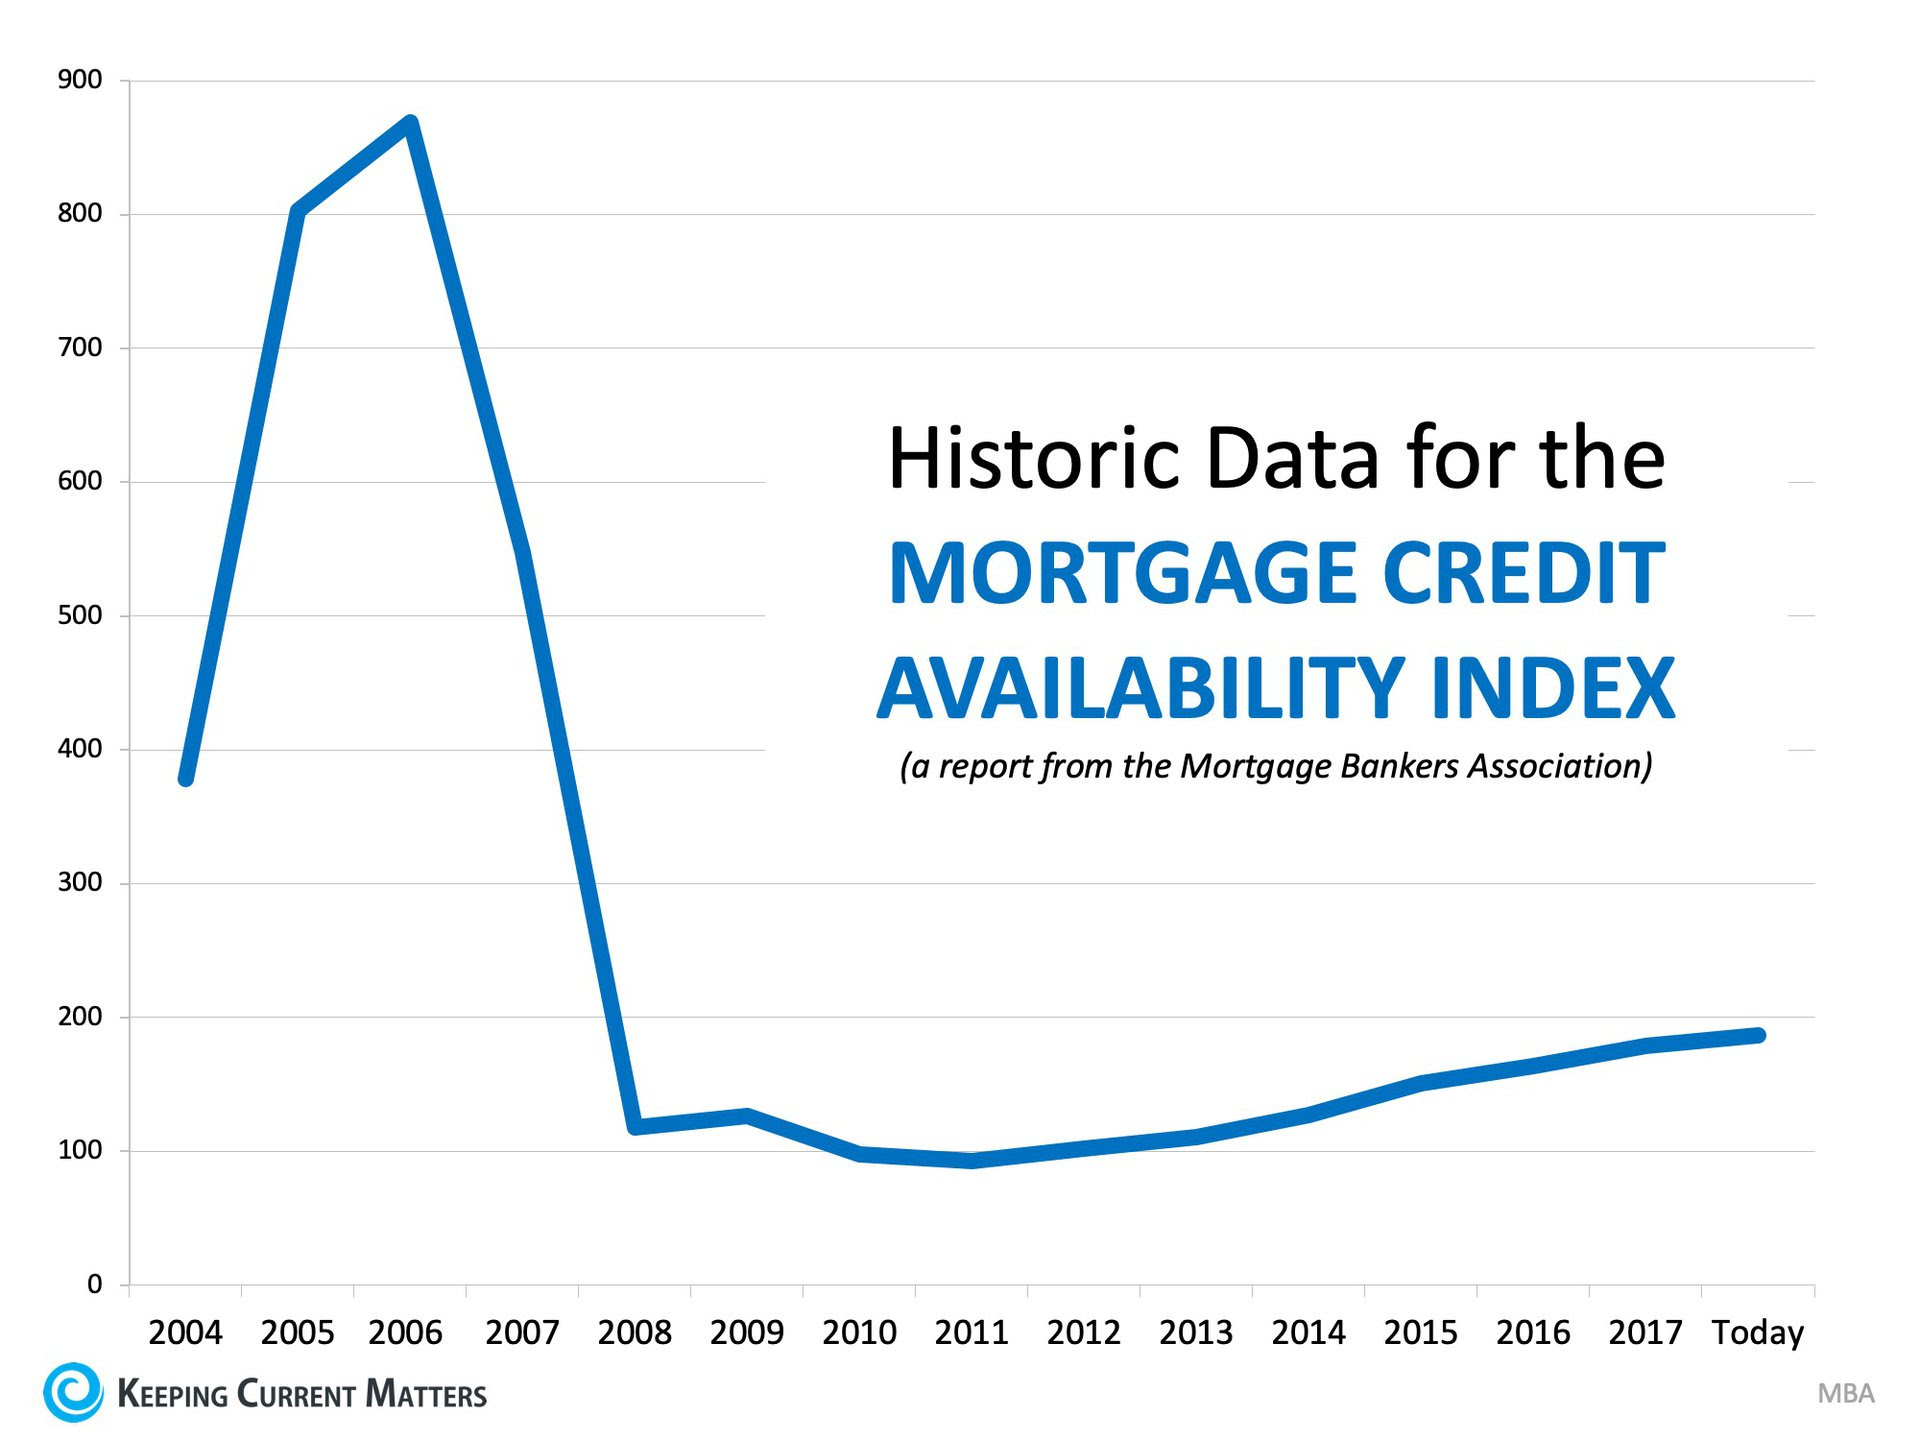
The higher the measurement, the easier it is to get a mortgage. During the buildup to the last housing bubble, the measurement sat at around 400. In 2005 and 2006, the measurement more than doubled to over 800 and was still at almost 600 in 2007. When the market crashed in 2008, the index fell to just over 100.
Over the last decade, as credit began to ease, the index increased to where it is today at 186.7 – still less than half of what it was prior to the buildup of last decade and less than one-quarter of where it was during the bubble.
Here is a graph depicting this information (remember, the higher the index, the easier it was to get a mortgage):
Bottom Line
Though mortgage standards have loosened somewhat during the last few years, we are nowhere near the standards that helped create the housing crisis ten years ago.
Wednesday, December 19, 2018
What If I Wait A Year to Buy a Home?

National home prices have increased by 5.4% since this time last year. Over that same time period, interest rates have remained near historic lows which has allowed many buyers to enter the market and lock in low rates.
As a seller, you will likely be most concerned about ‘short-term price’ – where home values are headed over the next six months. As a buyer, however, you must not be concerned about price but instead about the ‘long-term cost’ of the home.
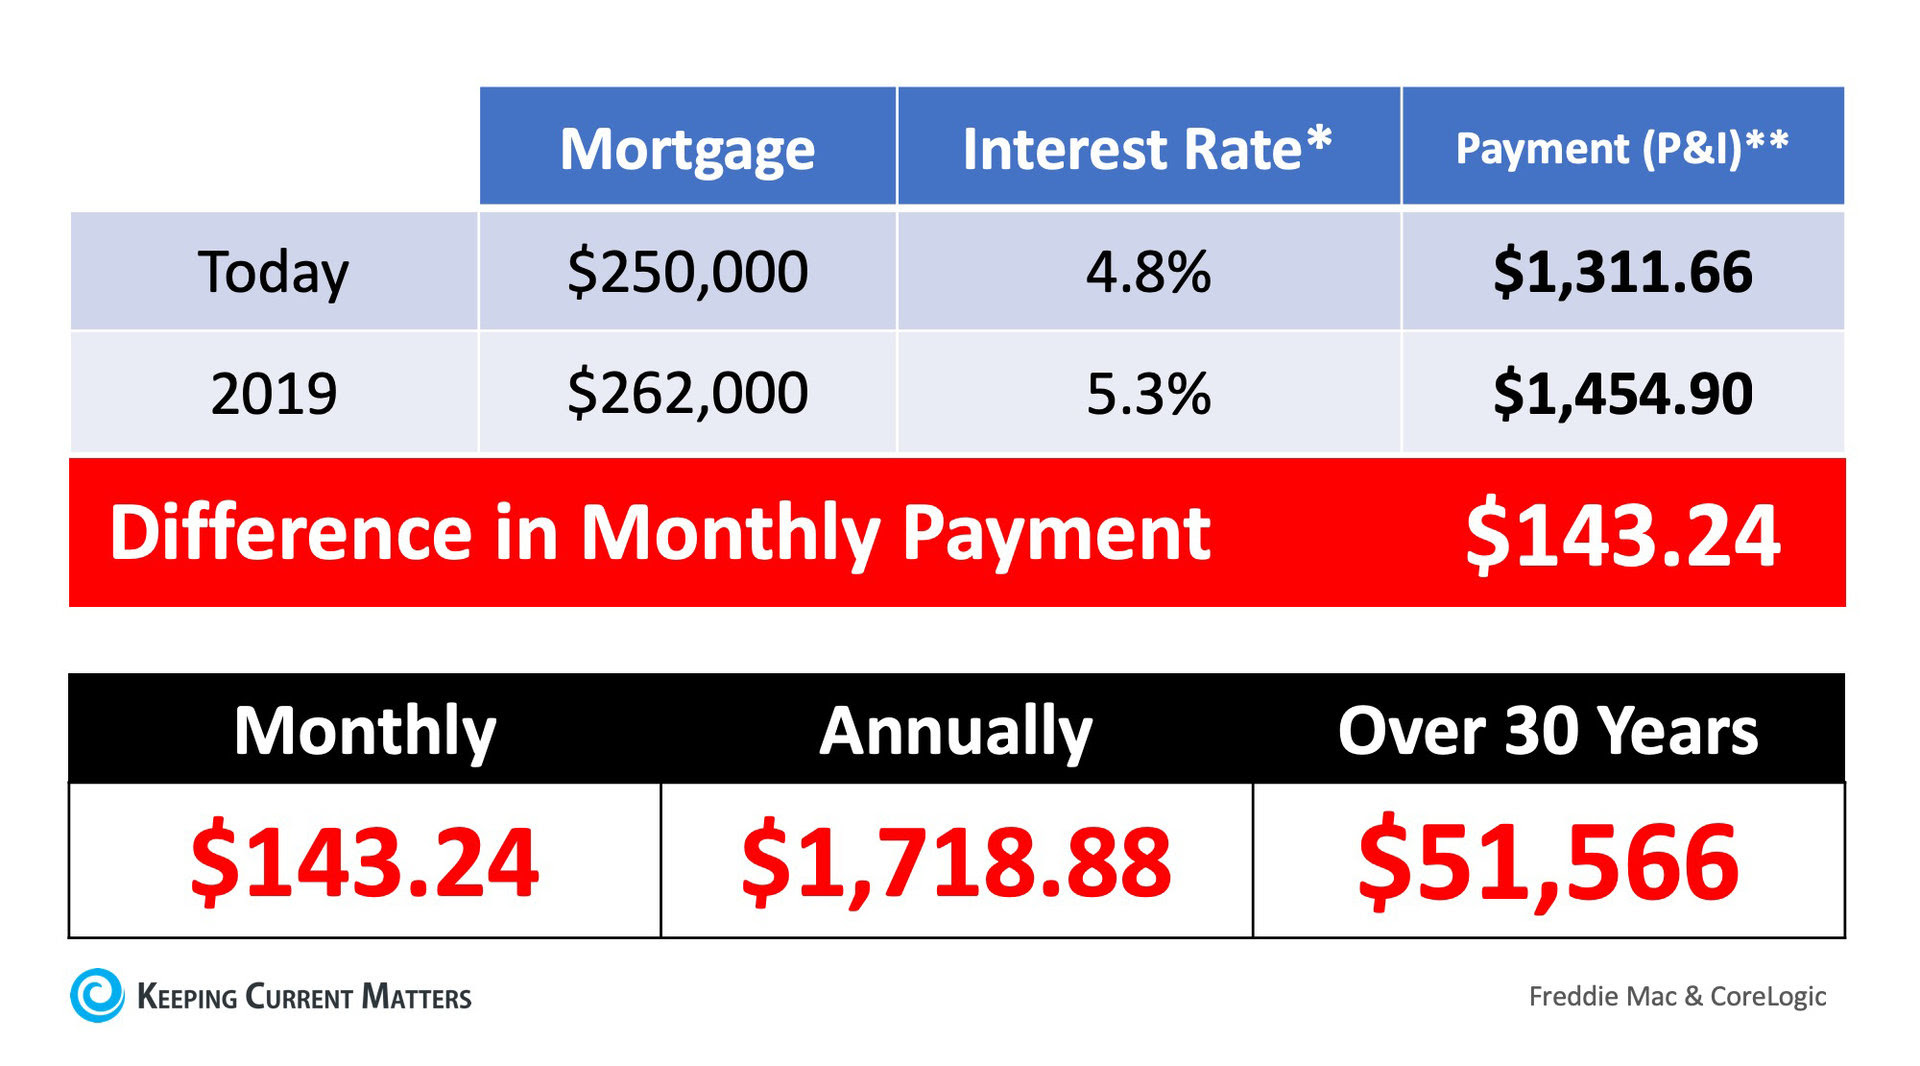
The Mortgage Bankers Association (MBA), Freddie Mac, and Fannie Mae all project that mortgage interest rates will increase by this time next year. According to CoreLogic’s most recent Home Price Insights Report, home prices will appreciate by 4.8% over the next 12 months.
What Does This Mean as a Buyer?
If home prices appreciate by 4.8% over the next twelve months as predicted by CoreLogic, here is a simple demonstration of the impact that an increase in interest rate would have on the mortgage payment of a home selling for approximately $250,000 today:
Bottom Line
If buying a home is in your plan for this year, doing it sooner rather than later could save you thousands of dollars over the terms of your loan.
Monday, December 17, 2018
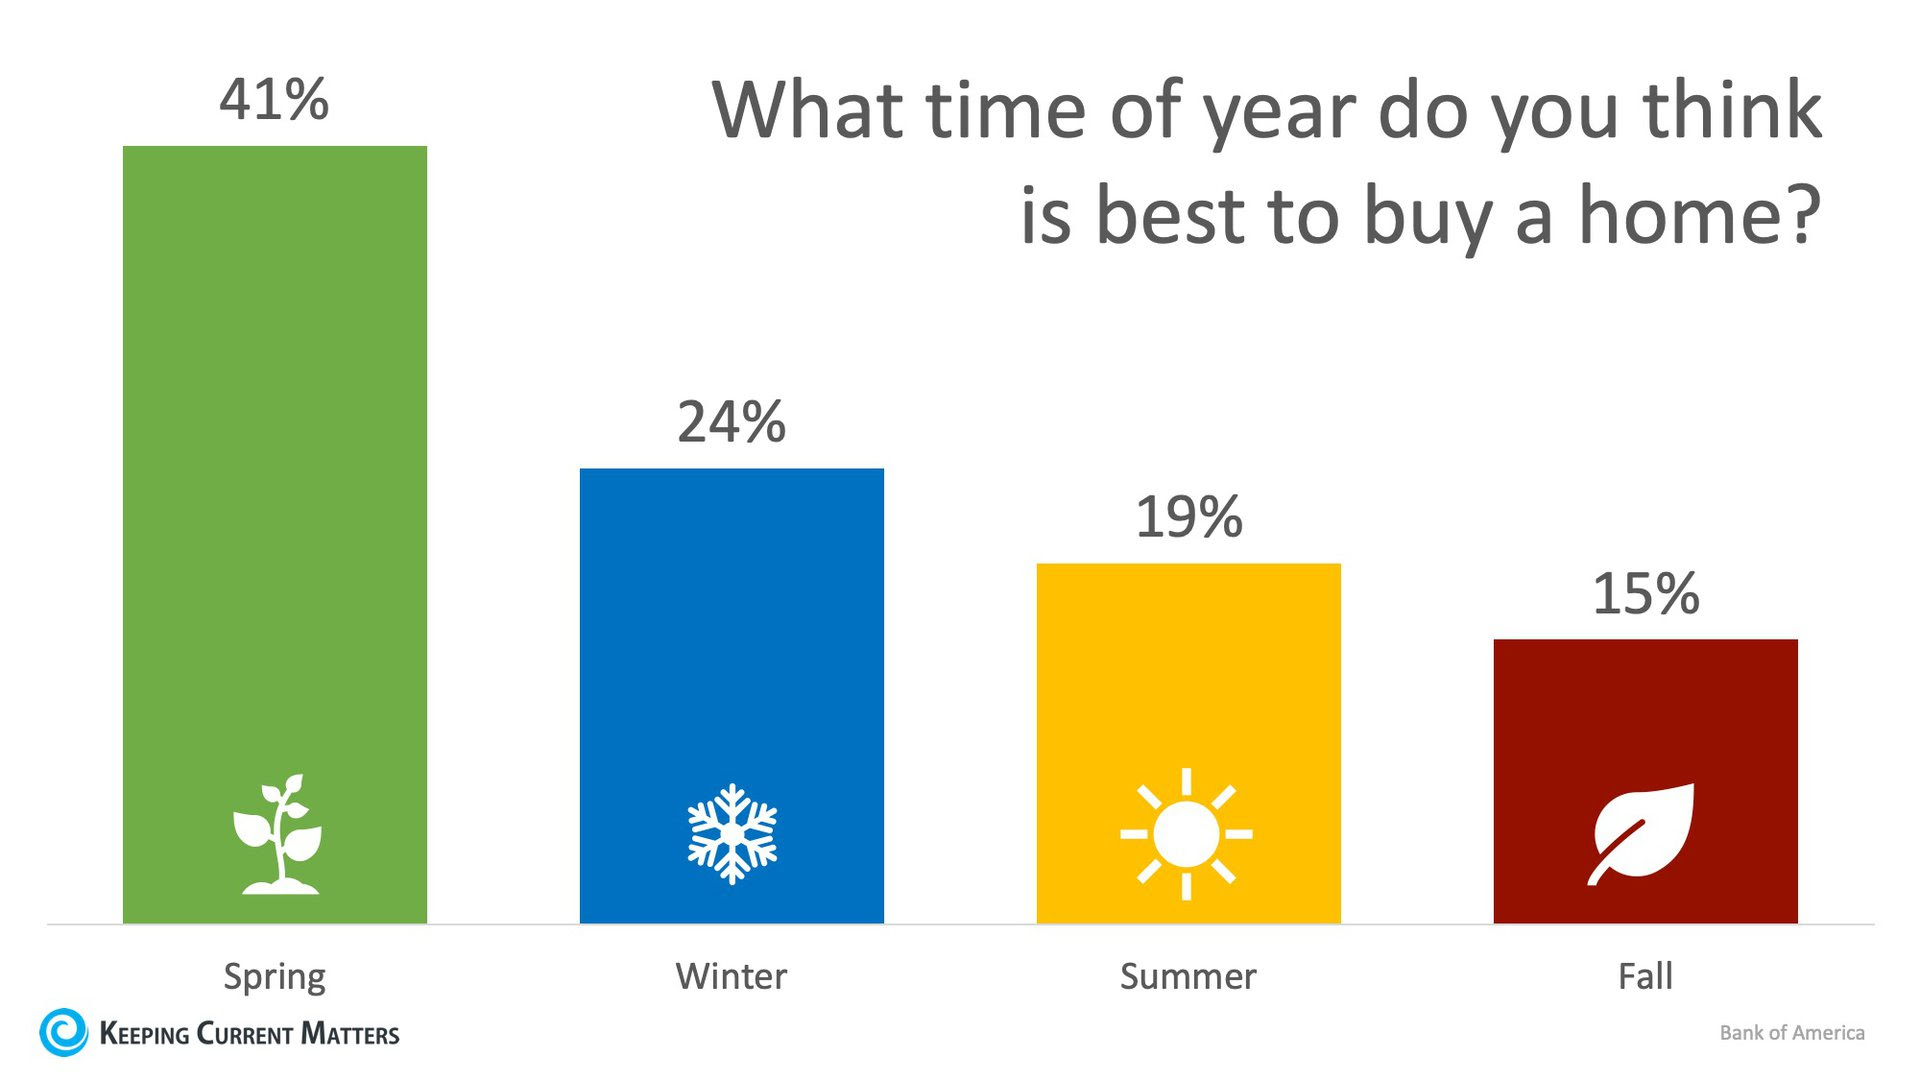
24% of Renters Believe Winter is the Best Time to Buy a Home

In real estate, the spring is often seen as the ideal time to buy or sell a house. The term “Spring Buyer’s Season” exists for a reason, as renters and those looking to move on from their current home thaw out from the winter and hit the market ready to buy.
According to Bank of America’s annual Home Buyer Insights Report, 41% of renters surveyed agree that spring is the best time to buy a home. The surprising result, however, is that when ranking the seasons, winter comes in second at 24%.
In many areas of the country, the spring and summer are the most competitive seasons for buyers. Families with children often want to move over the summer to make sure that their kids are ready for school in the fall. This often leads those families who haven’t found homes to buy to push pause on their search in the fall and winter months.
This creates a great environment for buyers to find a home with less competition. According to moving.com, scheduling a move during the winter months also comes with the best price.
“If you define ‘best’ by cost then, generally speaking, you are more likely to save on a move during the late September to April window. Demand for movers usually slows down during this time frame and rates are low.”
There are also many benefits to listing your house for sale during the winter months as well!
As we recently mentioned, buyers who are out in the winter are serious about wanting to find a home, and there is traditionally less competition on the market which gives you greater exposure to those buyers.
Bottom Line
As always, the best time to buy or move all depends on each individual buyer or seller’s goals and needs. If you are one of the many who would like to make a move this winter, contact a local real estate professional who can help you create a plan to make it happen!
Saturday, December 15, 2018
The #1 Reason to Not Wait Until Spring to Sell Your House

Many sellers believe that spring is the best time to place their homes on the market because buyer demand traditionally increases at that time of year, but what they don’t realize is that if every homeowner believes the same thing, then that is when they will have the most competition!
The #1 Reason to List Your Home in the Winter Months is Less Competition!
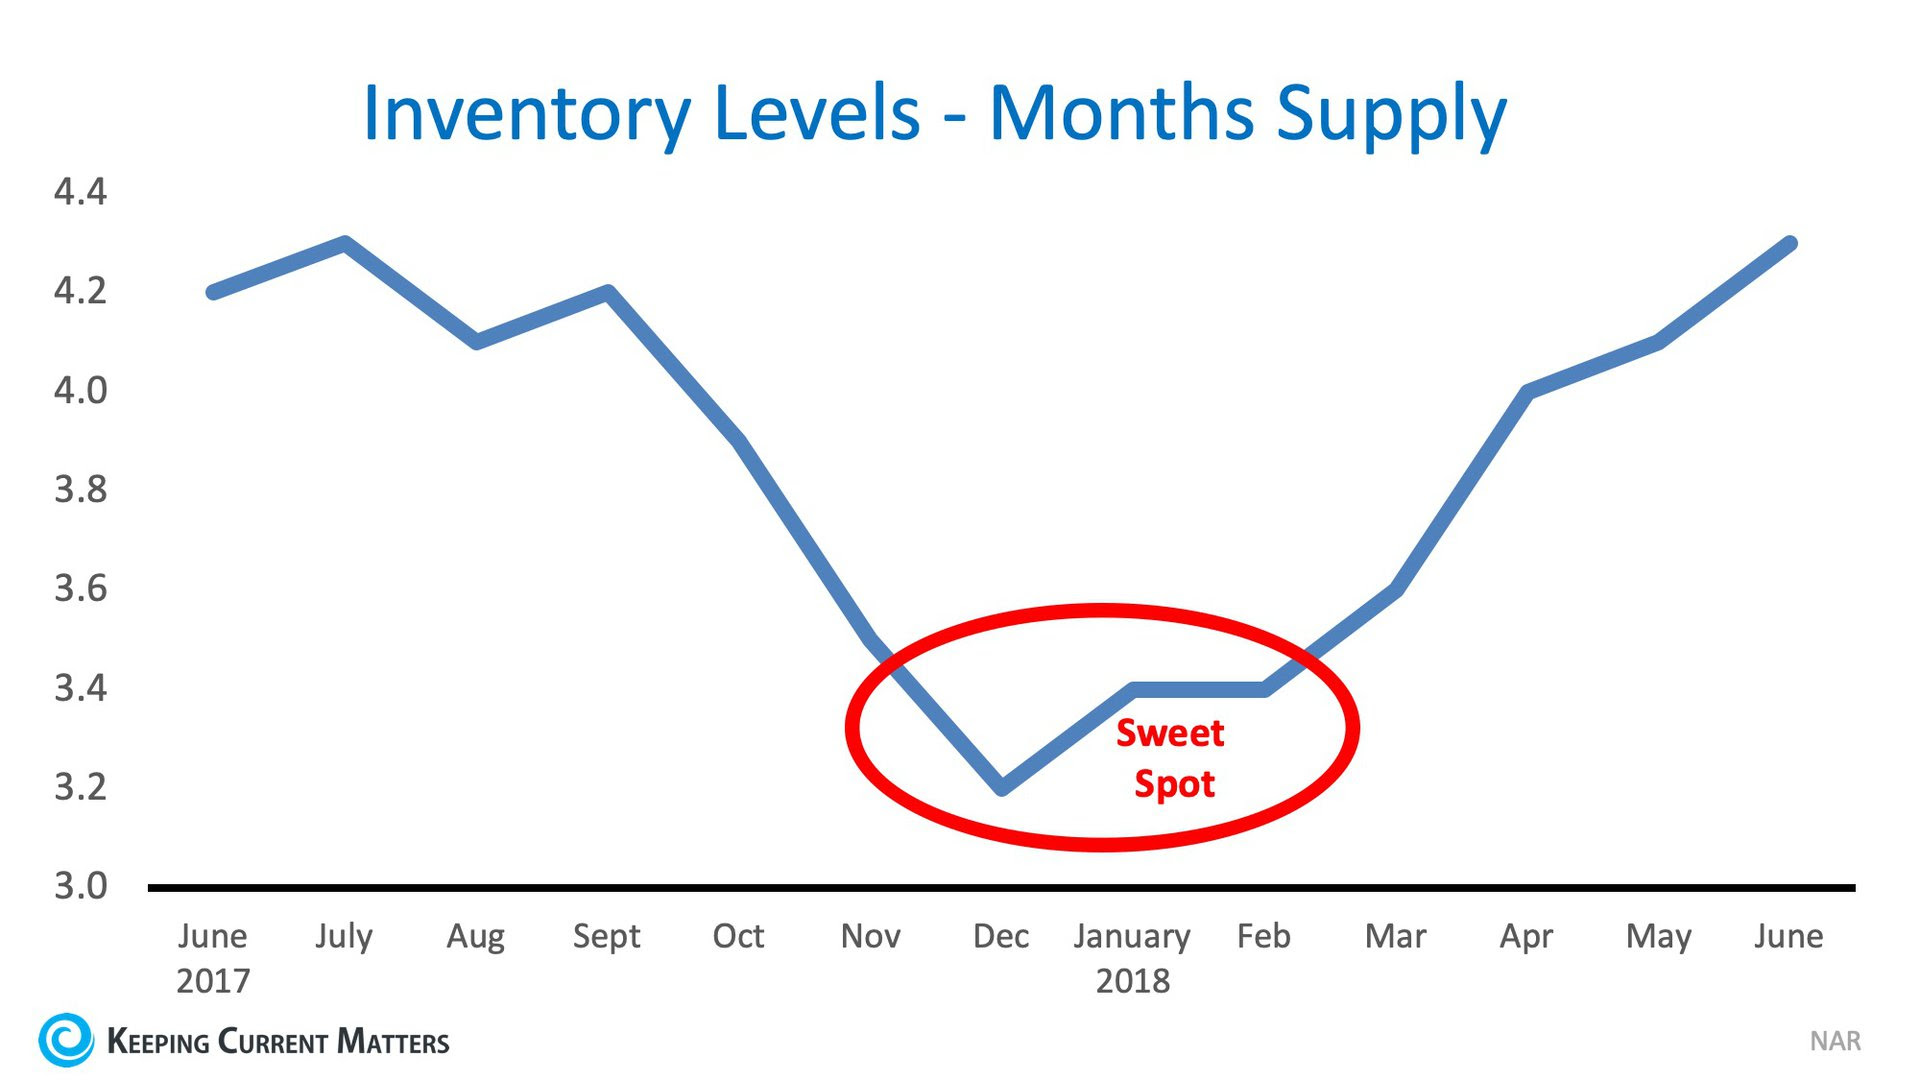
Housing supply traditionally shrinks at this time of year, so the choices buyers have will be limited. The chart below was created using the months’ supply of listings from the National Association of Realtors.
As you can see, the ‘sweet spot’ to list your home for the most exposure naturally occurs in the late fall and winter months (November – February).
Temperatures aren’t the only thing that heats up in the spring – so do listings!
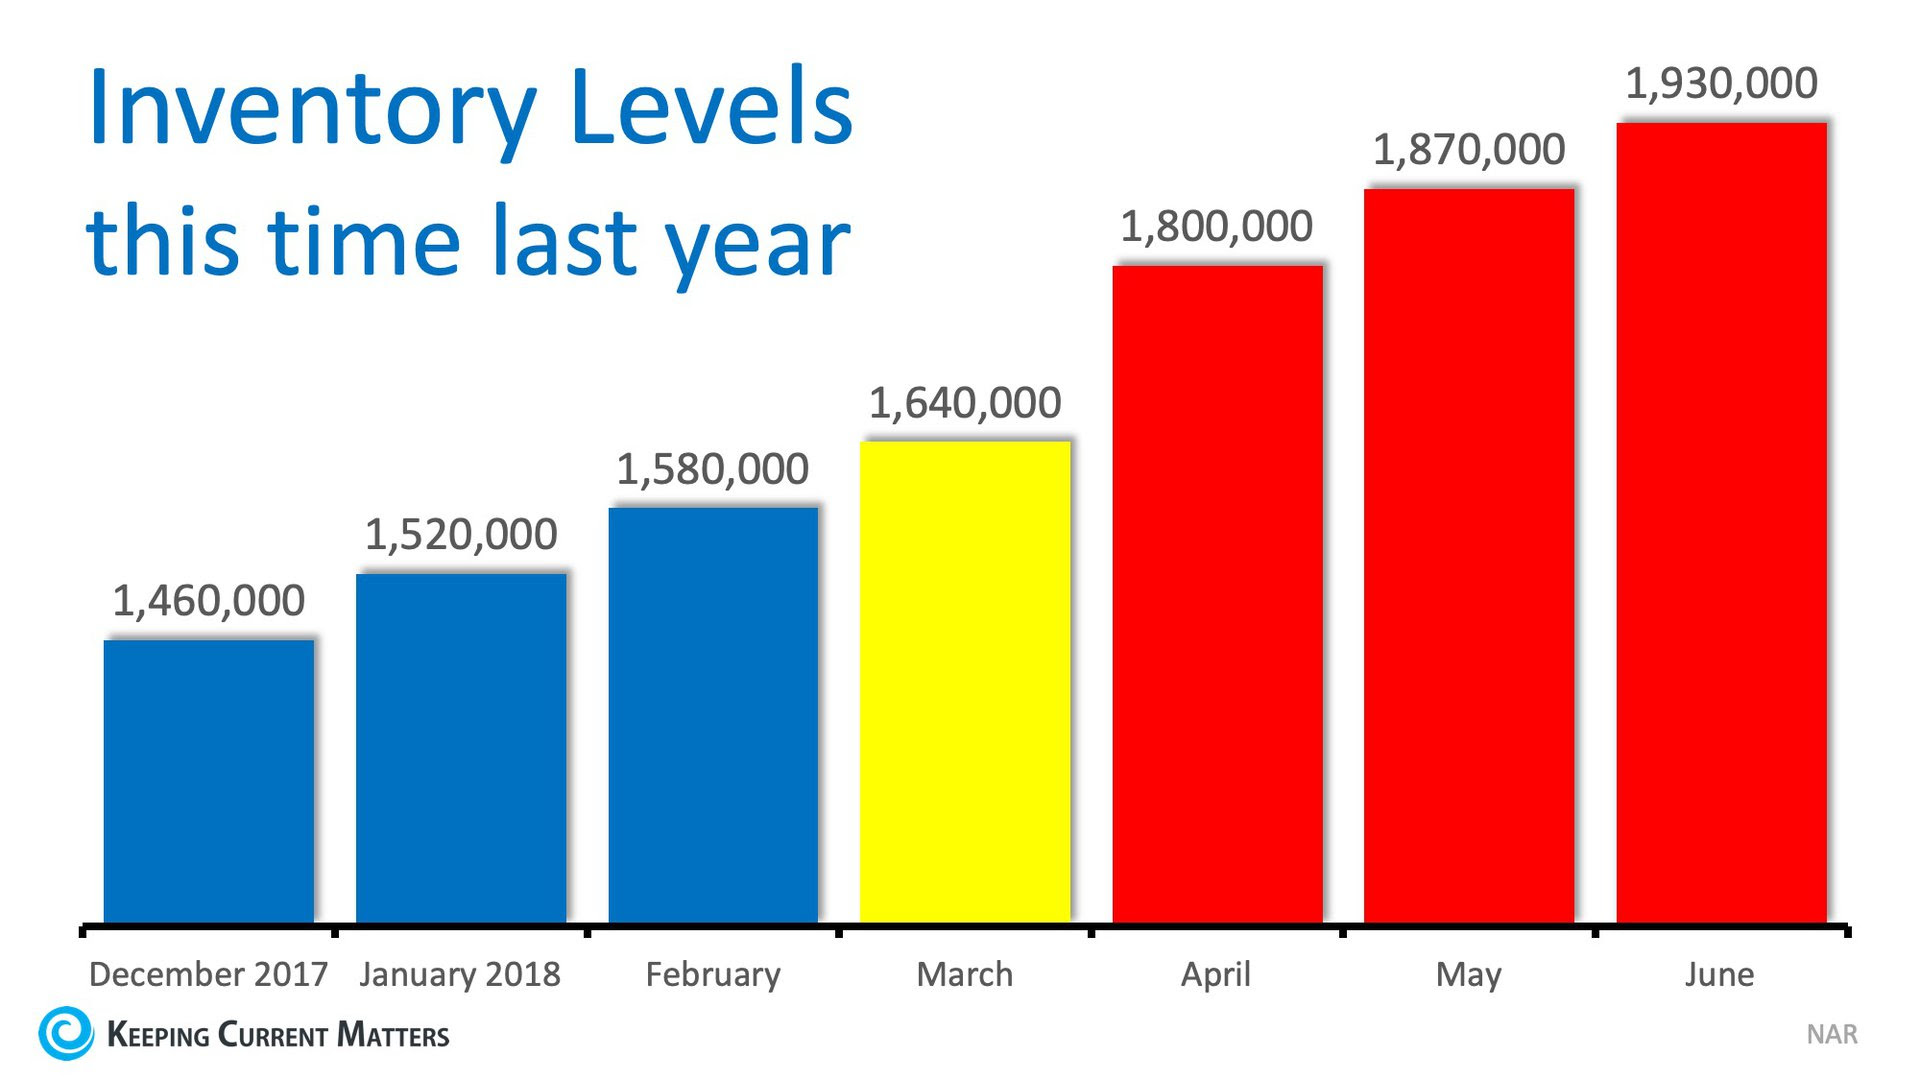
In 2017, listings increased by nearly half a million houses from December to June. Don’t wait for these listings to come to market before you decide to list your house.
Added Bonus: Only Serious Buyers Are Out in the Winter
At this time of year, only those purchasers who are serious about buying a home will be in the marketplace. You and your family will not be bothered and inconvenienced by mere ‘lookers.’ The lookers are at the mall or online doing their holiday shopping.
Bottom Line
If you have been debating whether or not to sell your home and are curious about market conditions in your area, talk with a local real estate professional who can help you decide the best time to list your house for sale.
Wednesday, December 12, 2018
Buyers: Don't Be Surprised by Closing Costs!

Many homebuyers think that saving for their down payment is enough to buy the house of their dreams, but what about the closing costs that are required to obtain a mortgage?
By law, a homebuyer will receive a loan estimate from their lender 3 days after submitting their loan application and they should receive a closing disclosure 3 days before the scheduled closing on their home. The closing disclosure includes final details about the loan and the closing costs.
But what are closing costs anyway?
According to Trulia:
“Closing costs are lender and third-party fees paid at the closing of a real estate transaction, and they can be financed as part of the deal or be paid upfront. They range from 2% to 5% of the purchase price of a home. (For those who buy a $150,000 home, for example, that would amount to between $3,000 and $7,500 in closing fees.)”
Keep in mind that if you are in the market for a home above this price range, your costs could be significantly greater. As mentioned before,
Closing costs are typically between 2% and 5% of your purchase price.
Trulia continues to give great advice, saying that:
“…understanding and educating yourself about these costs before settlement day arrives might help you avoid any headaches at the end of the deal.”
Bottom Line
Speak with your lender and agent early and often to determine how much you’ll be responsible for at closing. Finding out that you’ll need to come up with thousands of dollars right before closing is not a surprise anyone is ever looking forward to.
Monday, December 10, 2018
Thinking of Selling Your Home? Here's Why You Need A Pro in Your Corner

With home prices on the rise and buyer demand still strong, some sellers may be tempted to try and sell their homes on their own without using the services of a real estate professional.
Real estate agents are trained and experienced in negotiation and, in most cases, the seller is not. Sellers must realize that their ability to negotiate will determine whether or not they get the best deal for themselves and their families.
Here is a list of just some of the people with whom the seller must be prepared to negotiate with if they decide to For Sale by Owner (FSBO):
- The buyer who wants the best deal possible
- The buyer’s agent who solely represents the best interests of the buyer
- The buyer’s attorney (in some parts of the country)
- The home inspection companies, which work for the buyer and will almost always find some problems with the house
- The termite company if there are challenges
- The buyer’s lender if the structure of the mortgage requires the sellers’ participation
- The appraiser if there is a question of value
- The title company if there are challenges with certificates of occupancy (CO) or other permits
- The town or municipality if you need to get the CO permits mentioned above
- The buyer’s buyer in case there are challenges with the house your buyer is selling
Bottom Line
The percentage of sellers who have hired real estate agents to sell their homes has increased steadily over the last 20 years. Meet with a professional in your local market to see the difference that he or she can make in easing the selling process for you.
Saturday, December 8, 2018
Why Has Housing Supply Increased as Sales Have Slowed Down?

According to the latest Existing Home Sales Report from the National Association of Realtors (NAR), the inventory of homes for sale this year compared to last year has increased for the last four months, all while sales of existing homes have slowed compared to last year’s numbers.
For over three years leading up to this point, the exact opposite was true; Inventory dropped as sales soared.
NAR’s Chief Economist Lawrence Yun shed some light on what could be contributing to this shift,
“This is the lowest existing home sales level since November 2015. A decade’s high mortgage rates are preventing consumers from making quick decisions on home purchases. All the while, affordable home listings remain low, continuing to spur underperforming sales activity across the country.”
Let’s take a deeper look:
Interest Rates
Since January, 30-year fixed mortgage interest rates have increased nearly a full percentage point (from 3.95% to 4.9%). Fannie Mae, Freddie Mac, the National Association of Realtors, and the Mortgage Bankers Association are all in agreement that rates will continue to increase to about 5.2% over the next 12 months.
“The rise in [mortgage] rates paired with this very strong price appreciation absolutely is slowing housing,” said Fannie Mae’s Chief Economist Doug Duncan.
Even though rates are higher than they’ve been in a decade, they still remain below the average for the 1970s, 80s, 90s, and 2000s!
Mismatch of Inventory
Elizabeth Mendenhall, President of NAR, said it best, “Despite small month over month increases, the share of first-time buyers in the market continues to underwhelm because there are simply not enough listings in their price range.”
Prices of starter and trade-up homes have appreciated faster than their higher-priced counterparts. Over the last 5 years, the lowest-priced homes have appreciated by 47% while the highest-priced homes have appreciated by only 24%.
According to the Institute of Luxury Home Market’s Luxury Market Report, the $1M-and-up price range is now experiencing a buyer’s market. This means that supply (inventory) has finally caught up with demand and buyers are in the driver’s seat when it comes to negotiations. Additionally, many listings in this price range have experienced price cuts in order to entice buyers to put in offers.
Natural Disasters
Although not fully to blame for the national shortage in sales and inventory, natural disasters like Hurricane Florence, Hurricane Michael, and the wildfires on the West Coast have certainly had an impact.
Bottom Line
Additional inventory coming to market could help normalize the housing market and allow incomes to catch up to home prices. For more information about sales and inventory in your area, contact a local real estate agent who can help you make the best decision for you and your family.
Wednesday, December 5, 2018
Are Homeowners Renovating to Sell or to Stay?

Over the past few years, two trends have emerged in the housing market:
- Home renovations have shot up
- Inventory of homes available for sale on the market has dropped
A ‘normal’ housing market is defined by having a 6-month supply of homes for sale. According to the latest Existing Home Sales Report from the National Association of Realtors, we are currently at a 4.4-month supply.
This low inventory environment has many current homeowners worried that they would be unable to find a home to buy if they were to list and sell their current houses, which is causing many homeowners to instead renovate their homes in an attempt to fit their needs.
According to Home Advisor, homeowners spent an average of $6,649 on home improvements over the last 12 months. If that number seems high, it also includes homeowners who recently bought fixer-uppers.
A new study from Zillow asked the question,
“Given a choice between spending a fixed amount of money on a down payment for a new home or fixing up their current home, what would you do?”
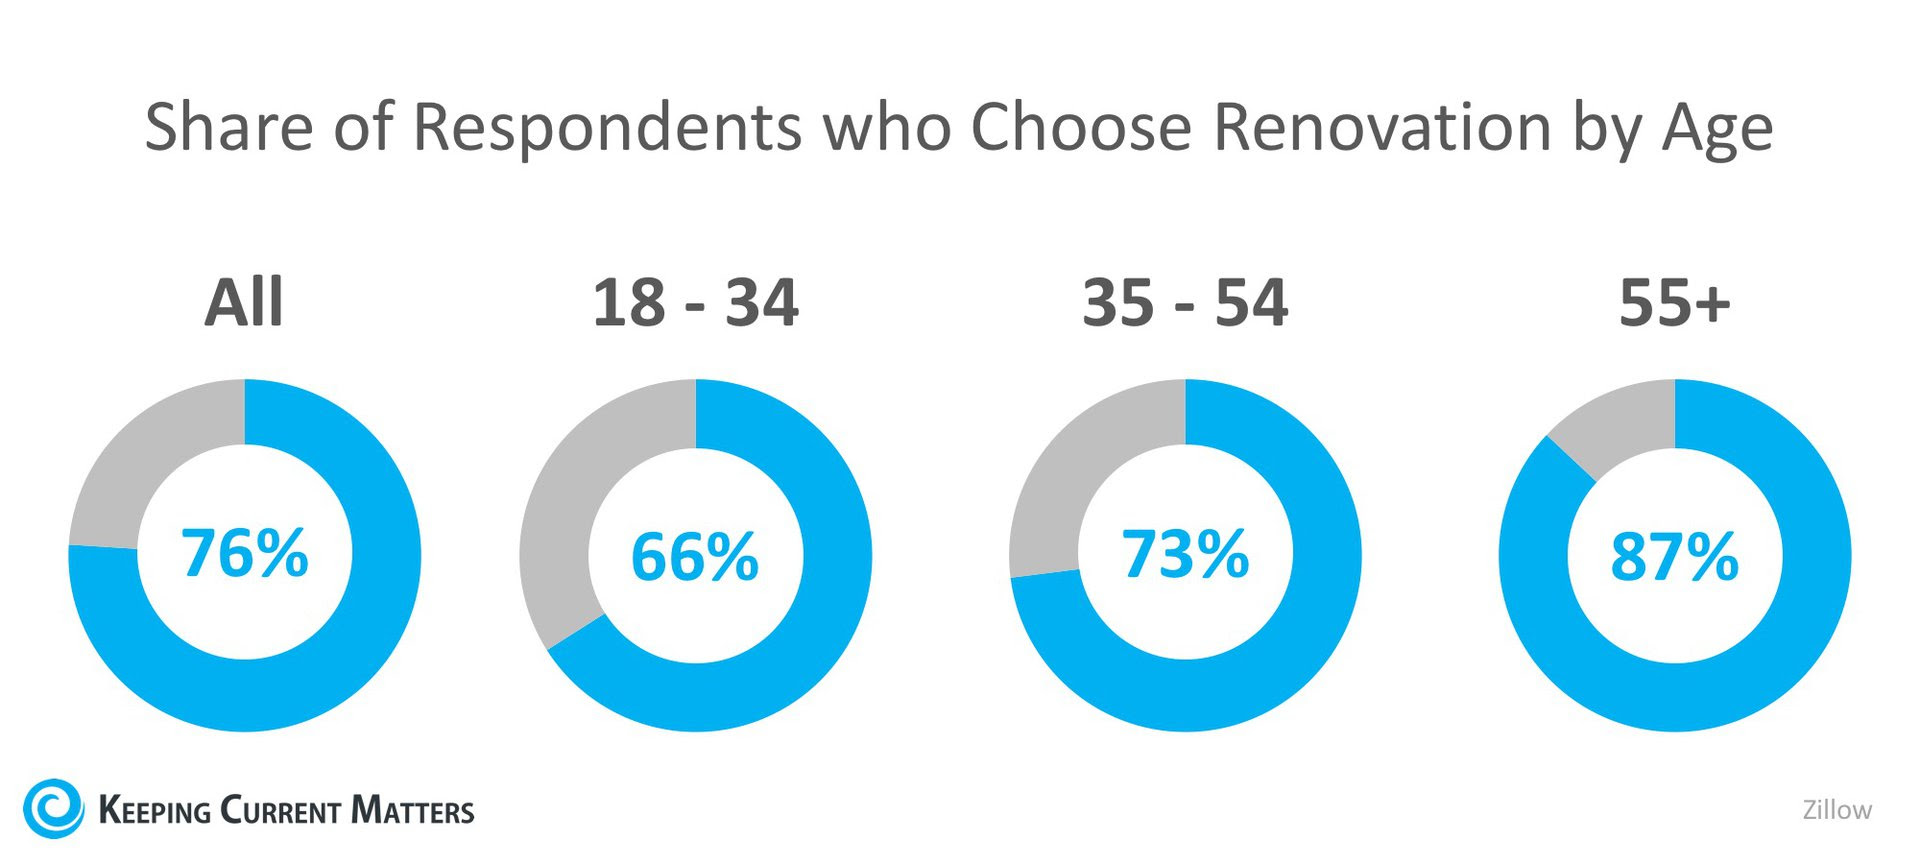
Seventy-six percent of those surveyed said that they would rather renovate their current homes than move. The results are broken down by generation below.
More and more studies are coming out about the intention that many Americans have to ‘age in place’ (or retire in the area in which they live). Among retirees, 91% would prefer to renovate than spend their available funds on a down payment on a new home.
If their current house fits their needs as far as space and accessibility are concerned, then a renovation could make sense. But if renovations will end up changing the identity of the home and impacting resale value, then the renovations may end up costing them more in the long run.
With home prices increasing steadily for the last 6.5 years, homeowners have naturally gained equity that they may not even be aware of. Listing your house for sale in this low-competition environment could net you more money than your renovations otherwise would.
Bottom Line
If you are one of the many homeowners who is thinking about remodeling instead of selling, sit down with a local real estate professional who can help you make the right decision for you based on the demand for your house in today’s market.
Monday, December 3, 2018
Home Sellers in Q3 Netted $61K at Resale

According to a recent report by ATTOM Data Solutions, home sellers who sold their homes in the third quarter of 2018 benefited from rising home prices and netted an average of $61,232.
This is the highest average price gain since the second quarter of 2007 and represents a 32% return on the original purchase prices.
After the Great Recession, many homeowners were left in negative equity situations but home price appreciation in the recovery period since then has given homeowners something to smile about.
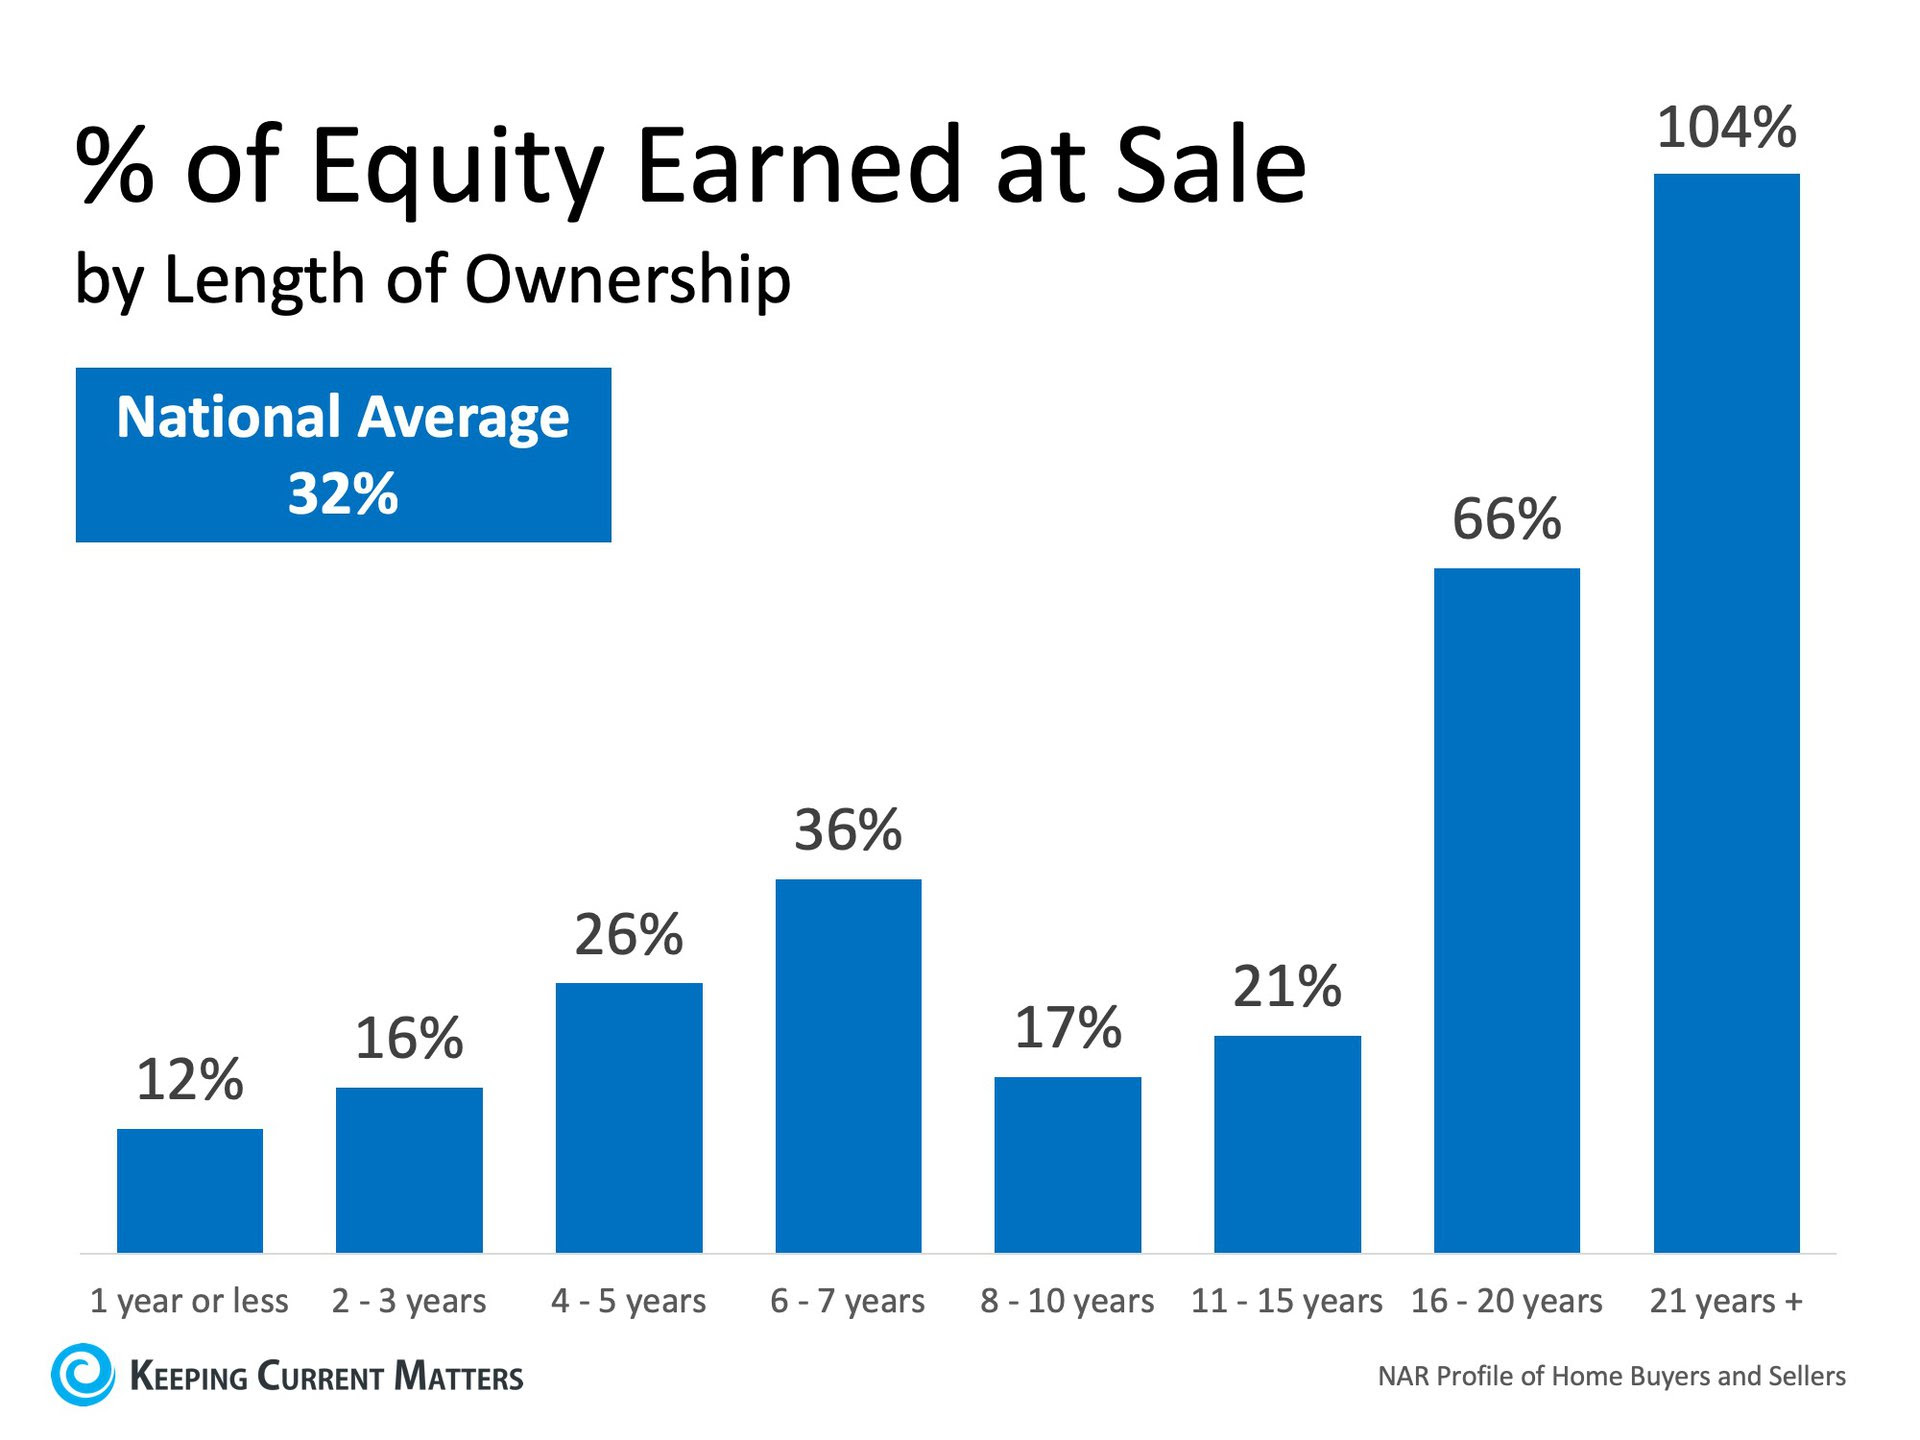
The results from ATTOM fall right in line with data from the latest edition of the National Association of Realtors’ (NAR) Profile of Home Buyers and Sellers. Below is a chart that was created using NAR’s data to show the percentage of equity that homeowners earned at the time of sale based on when they purchased their homes.
Even though those who purchased at the peak of the market netted less than those who bought before and after the peak, the good news is that there was a double-digit profit to be had! Many homeowners believe that they are still underwater which has led many of them to not even consider selling their houses.
Bottom Line
If you are curious about how much equity you’d earn if you sold your home, contact a local real estate professional for an equity review. They can help you determine the demand for your home in today’s market and help you develop a plan!
Wednesday, November 28, 2018
2 Myths Holding Back Home Buyers

Urban Institute recently released a report entitled, “Barriers to Accessing Homeownership: Down Payment, Credit, and Affordability,” which revealed that,
“Consumers often think they need to put more money down to purchase a home than is actually required. In a 2017 survey, 68% of renters cited saving for a down payment as an obstacle to homeownership. Thirty-nine percent of renters believe that more than 20% is needed for a down payment and many renters are unaware of low–down payment programs.”
Myth #1: “I Need a 20% Down Payment”
Buyers often overestimate the down payment funds needed to qualify for a home loan. According to the same report:
“Most potential homebuyers are largely unaware that there are low-down payment and no-down payment assistance programs available at the local, state, and federal levels to help eligible borrowers secure an affordable down payment.”
These numbers do not differ much between non-owners and homeowners. For example, “30% of homeowners and 39% of renters believe that you need more than 20 percent for a down payment.”
While many believe that they need at least 20% down to buy their dream homes, they do not realize that there are programs available which allow them to put down as little as 3%. Many renters may actually be able to enter the housing market sooner than they ever imagined with programs that have emerged allowing less cash out of pocket.
Myth #2: “I Need a 780 FICO® Score or Higher to Buy”
Similar to the down payment, many either don’t know or are misinformed about what FICO® score is necessary to qualify.
Many Americans believe a ‘good’ credit score is 780 or higher.
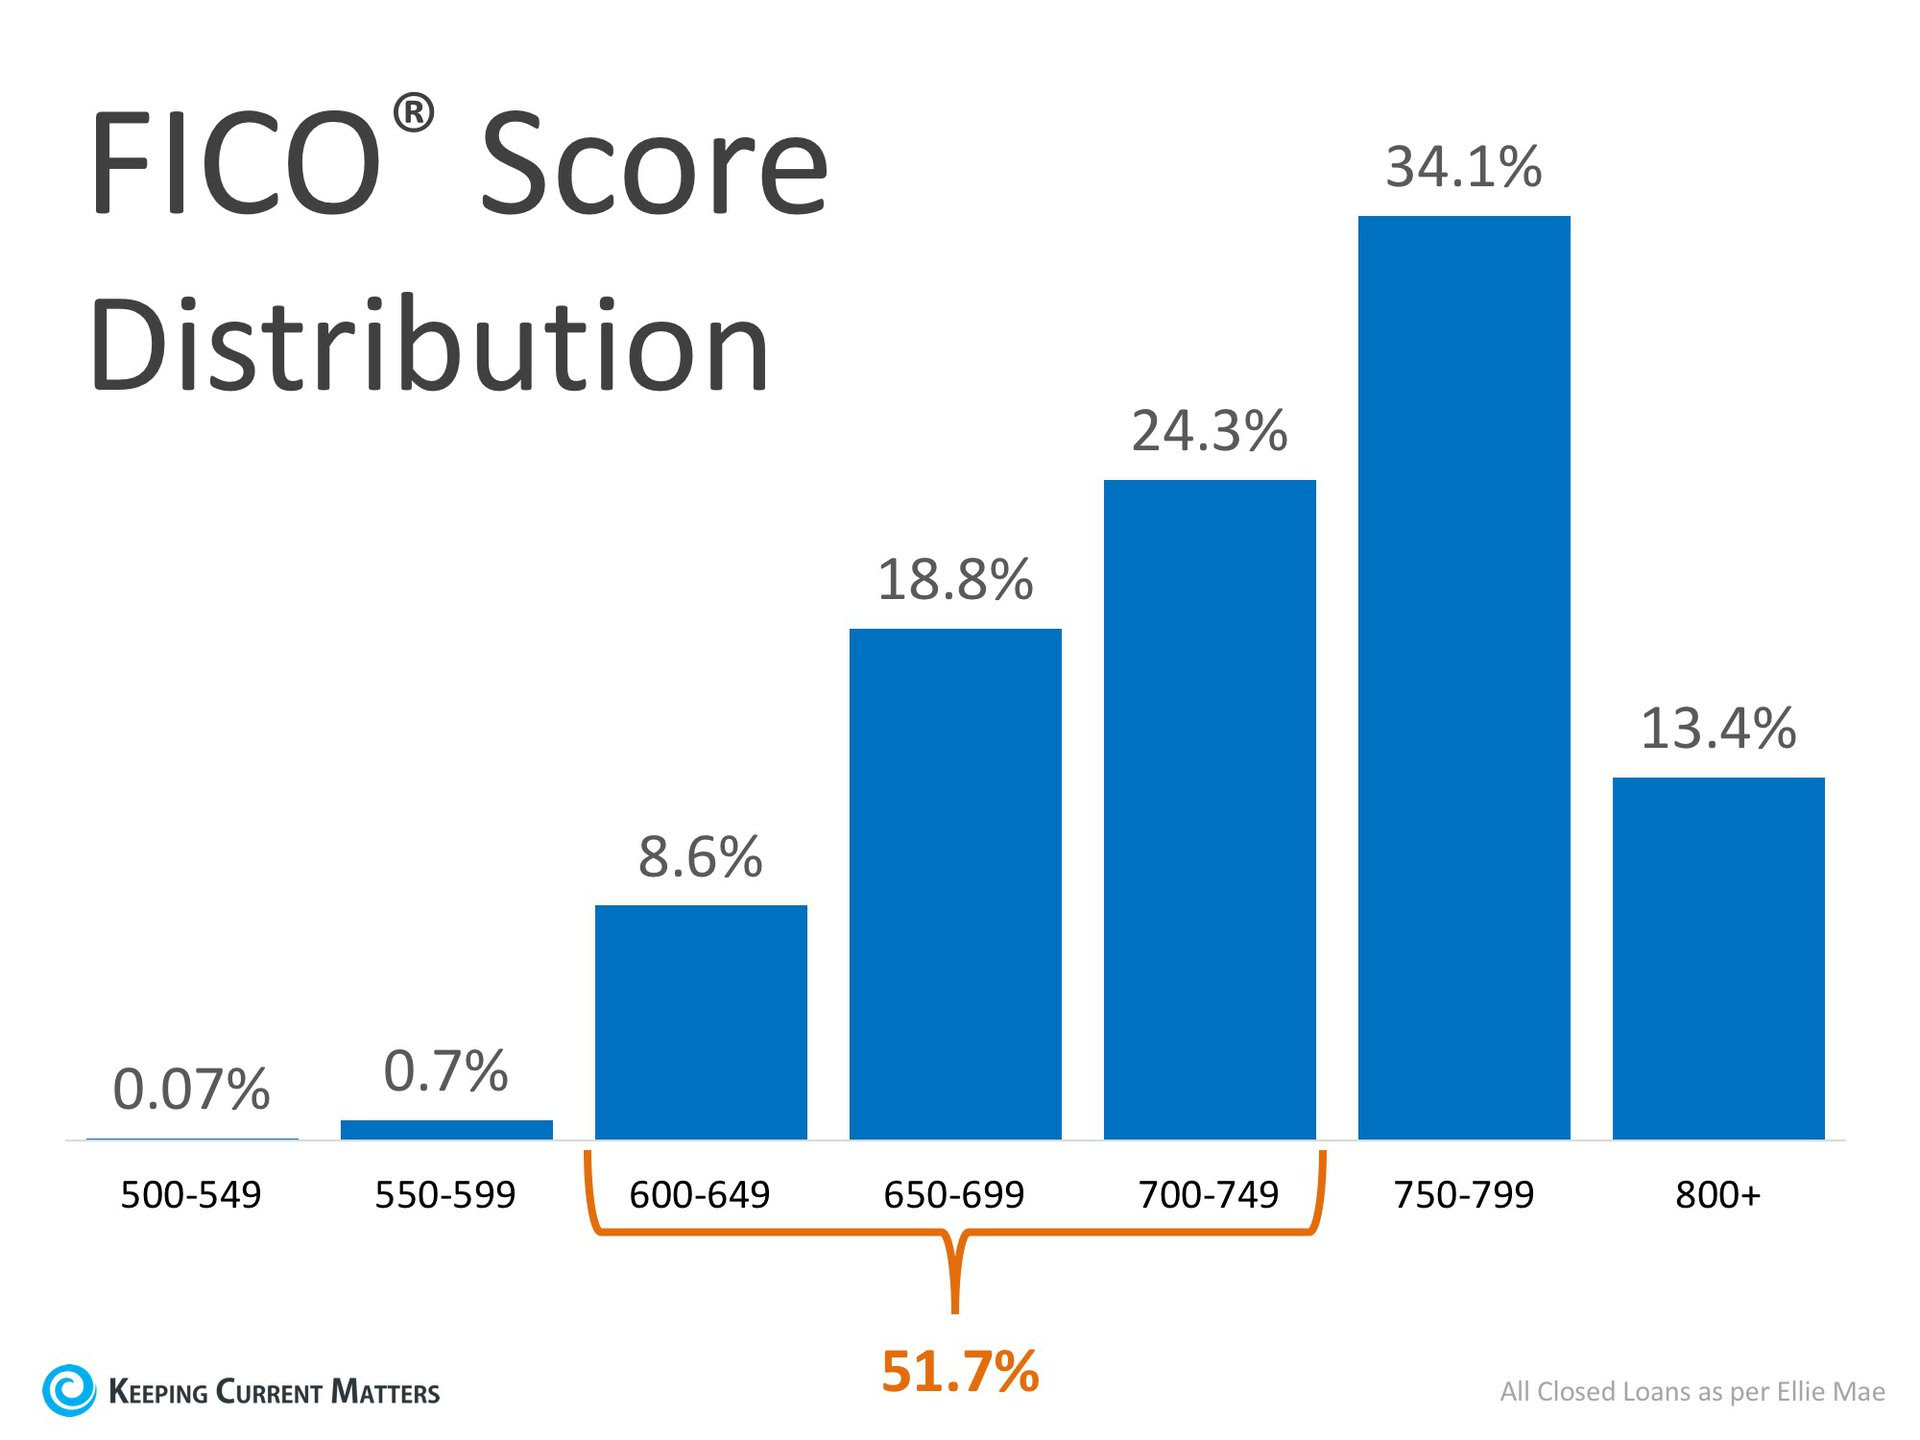
To help debunk this myth, let’s take a look at Ellie Mae’s latest Origination Insight Report, which focuses on recently closed (approved) loans.
As you can see in the chart above, 51.7% of approved mortgages had a credit score of 600-749.
Bottom Line
Whether buying your first home or moving up to your dream home, knowing your options will make the mortgage process easier. Your dream home may already be within your reach.
Monday, November 26, 2018
Wage Increases Make Home Buying More Affordable
 How much a family earns obviously impacts how easy or difficult it is for them to afford to own a home. Because of an improving economy, wages are finally beginning to increase – and that dramatically affects home affordability. According to the National Association of Realtors’ (NAR) September 2018 Housing Affordability Index, wages have increased in every region of the country: 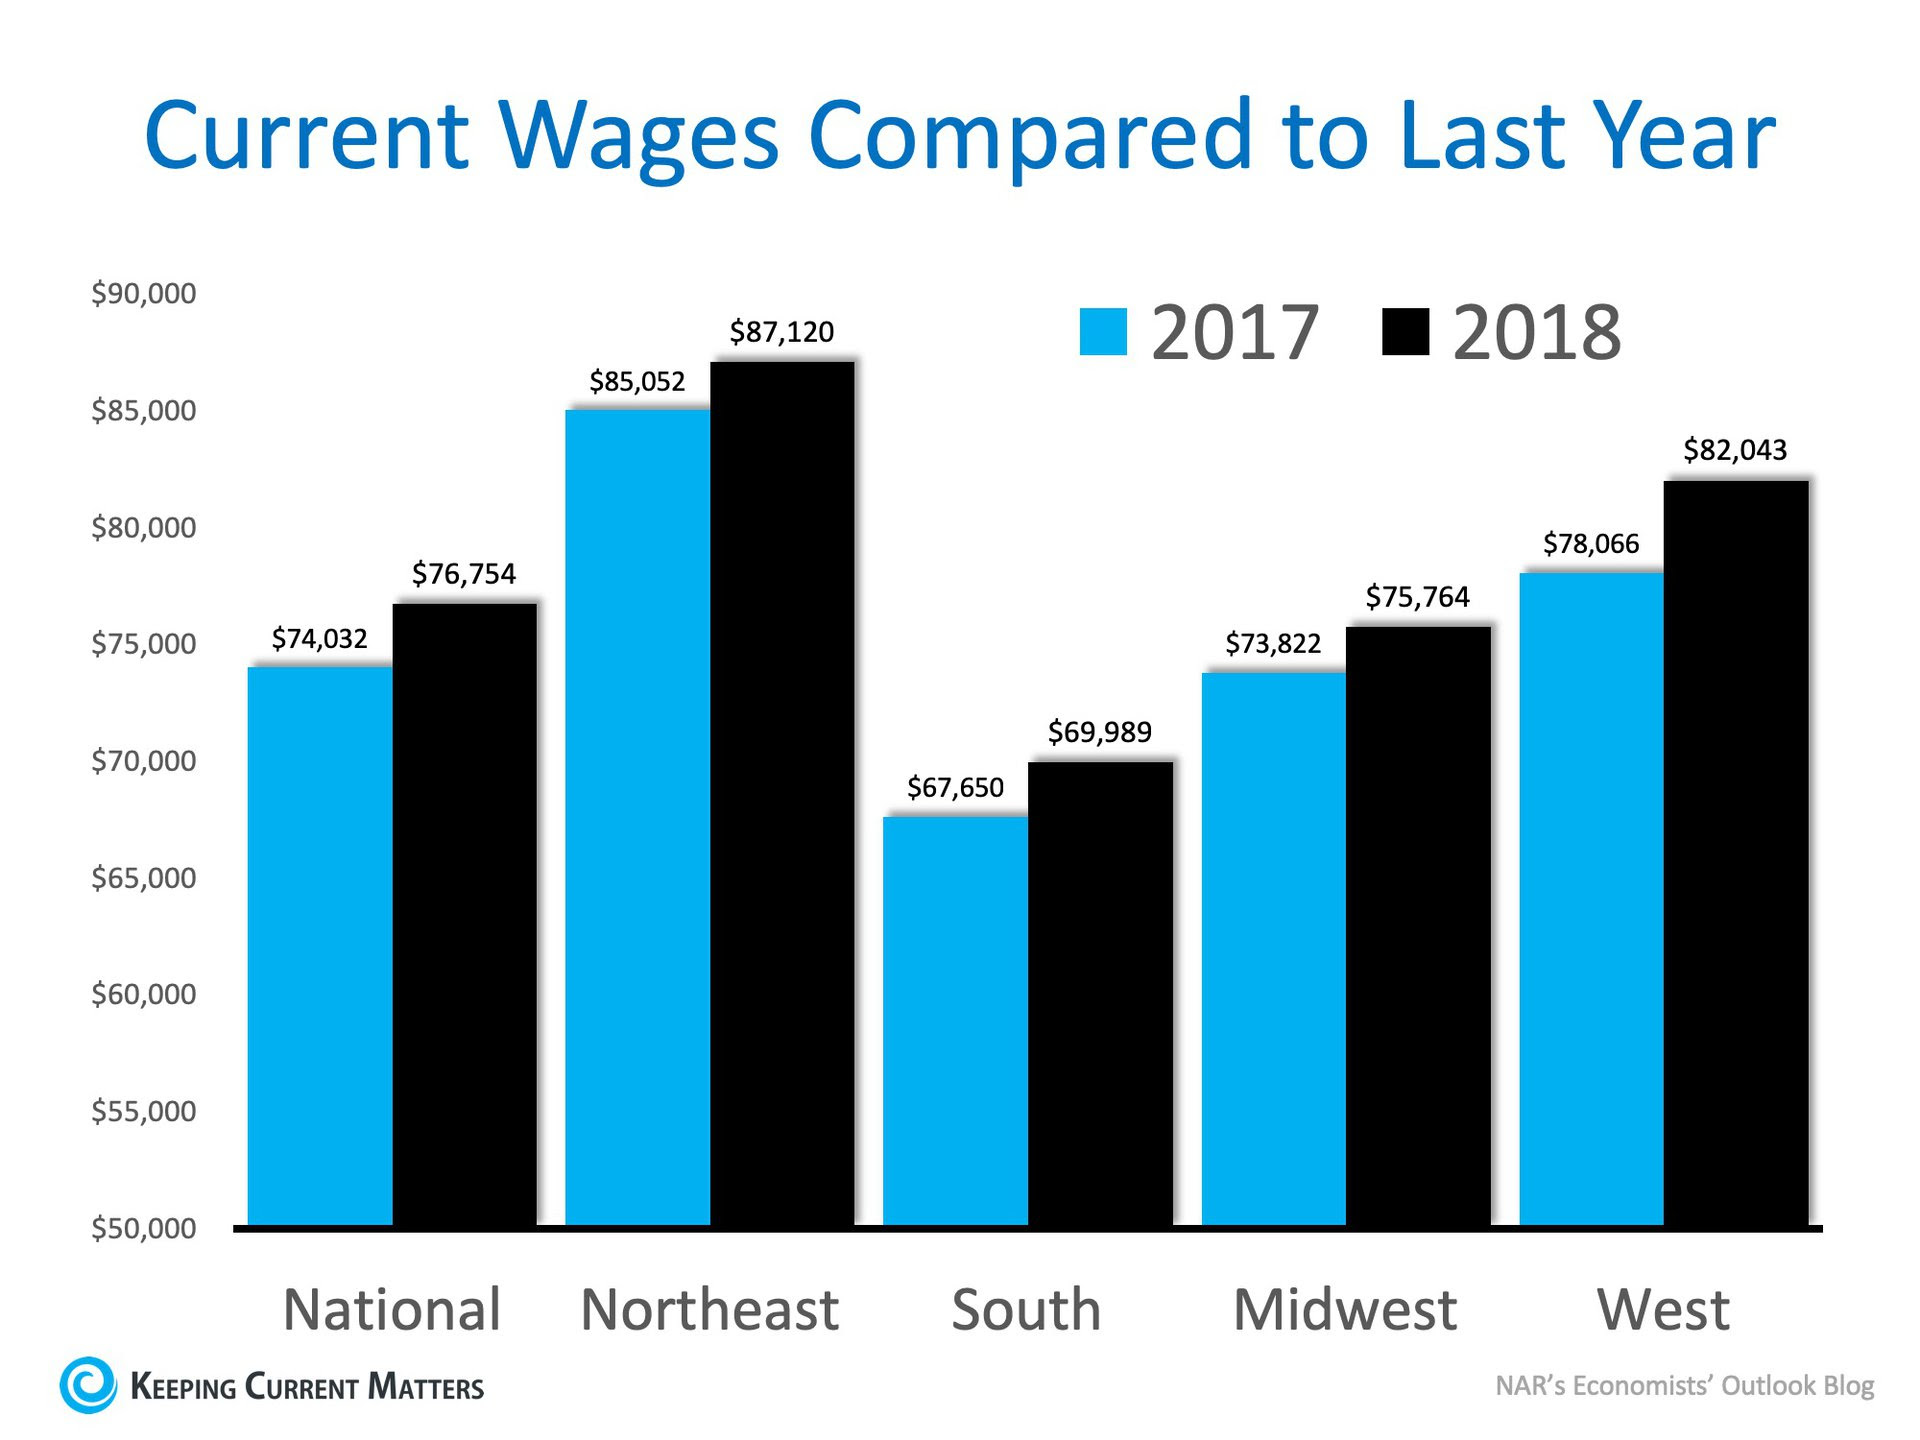 After applying current salaries, home prices, and mortgage rates to their Home Affordability Index equation, the index, though still lower than this time last year (160.1 to 146.7), increased over the last month (141.2 to 146.7). For the complete methodology used by NAR,click here. The percentage of income needed to own a home has also decreased each of the last three months. It currently sits at 17% which is substantially lower than historic numbers. 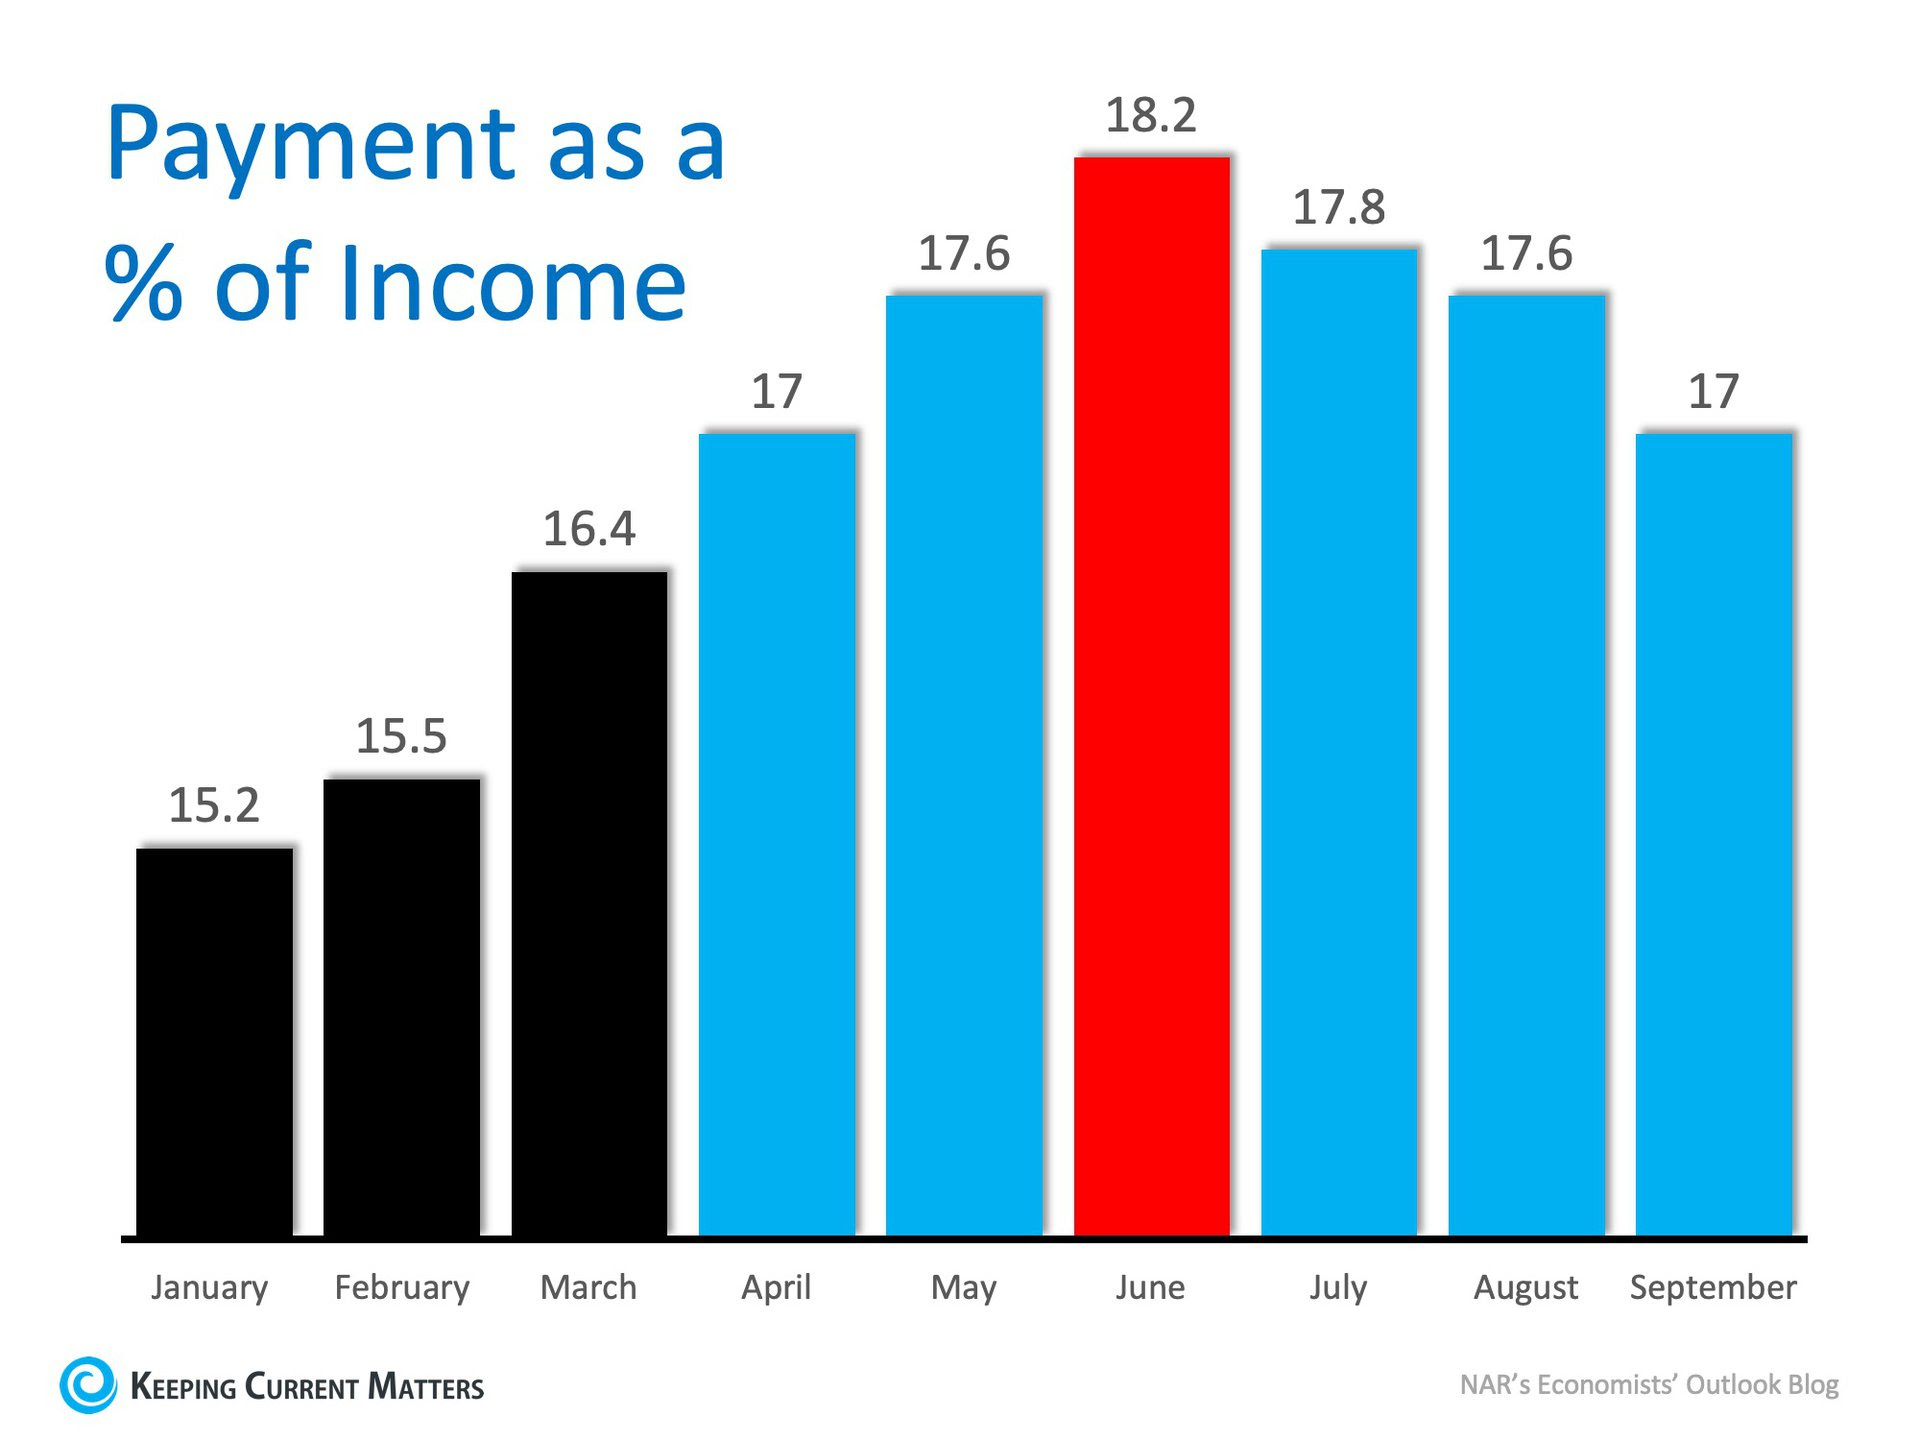 Bottom LineIf you are a first-time buyer or a move-up buyer who believes that purchasing a home is not within your budget, check with a local real estate professional to find out if that is still true. |
Wednesday, November 21, 2018
How Will Home Sales Measure Up Next Year?

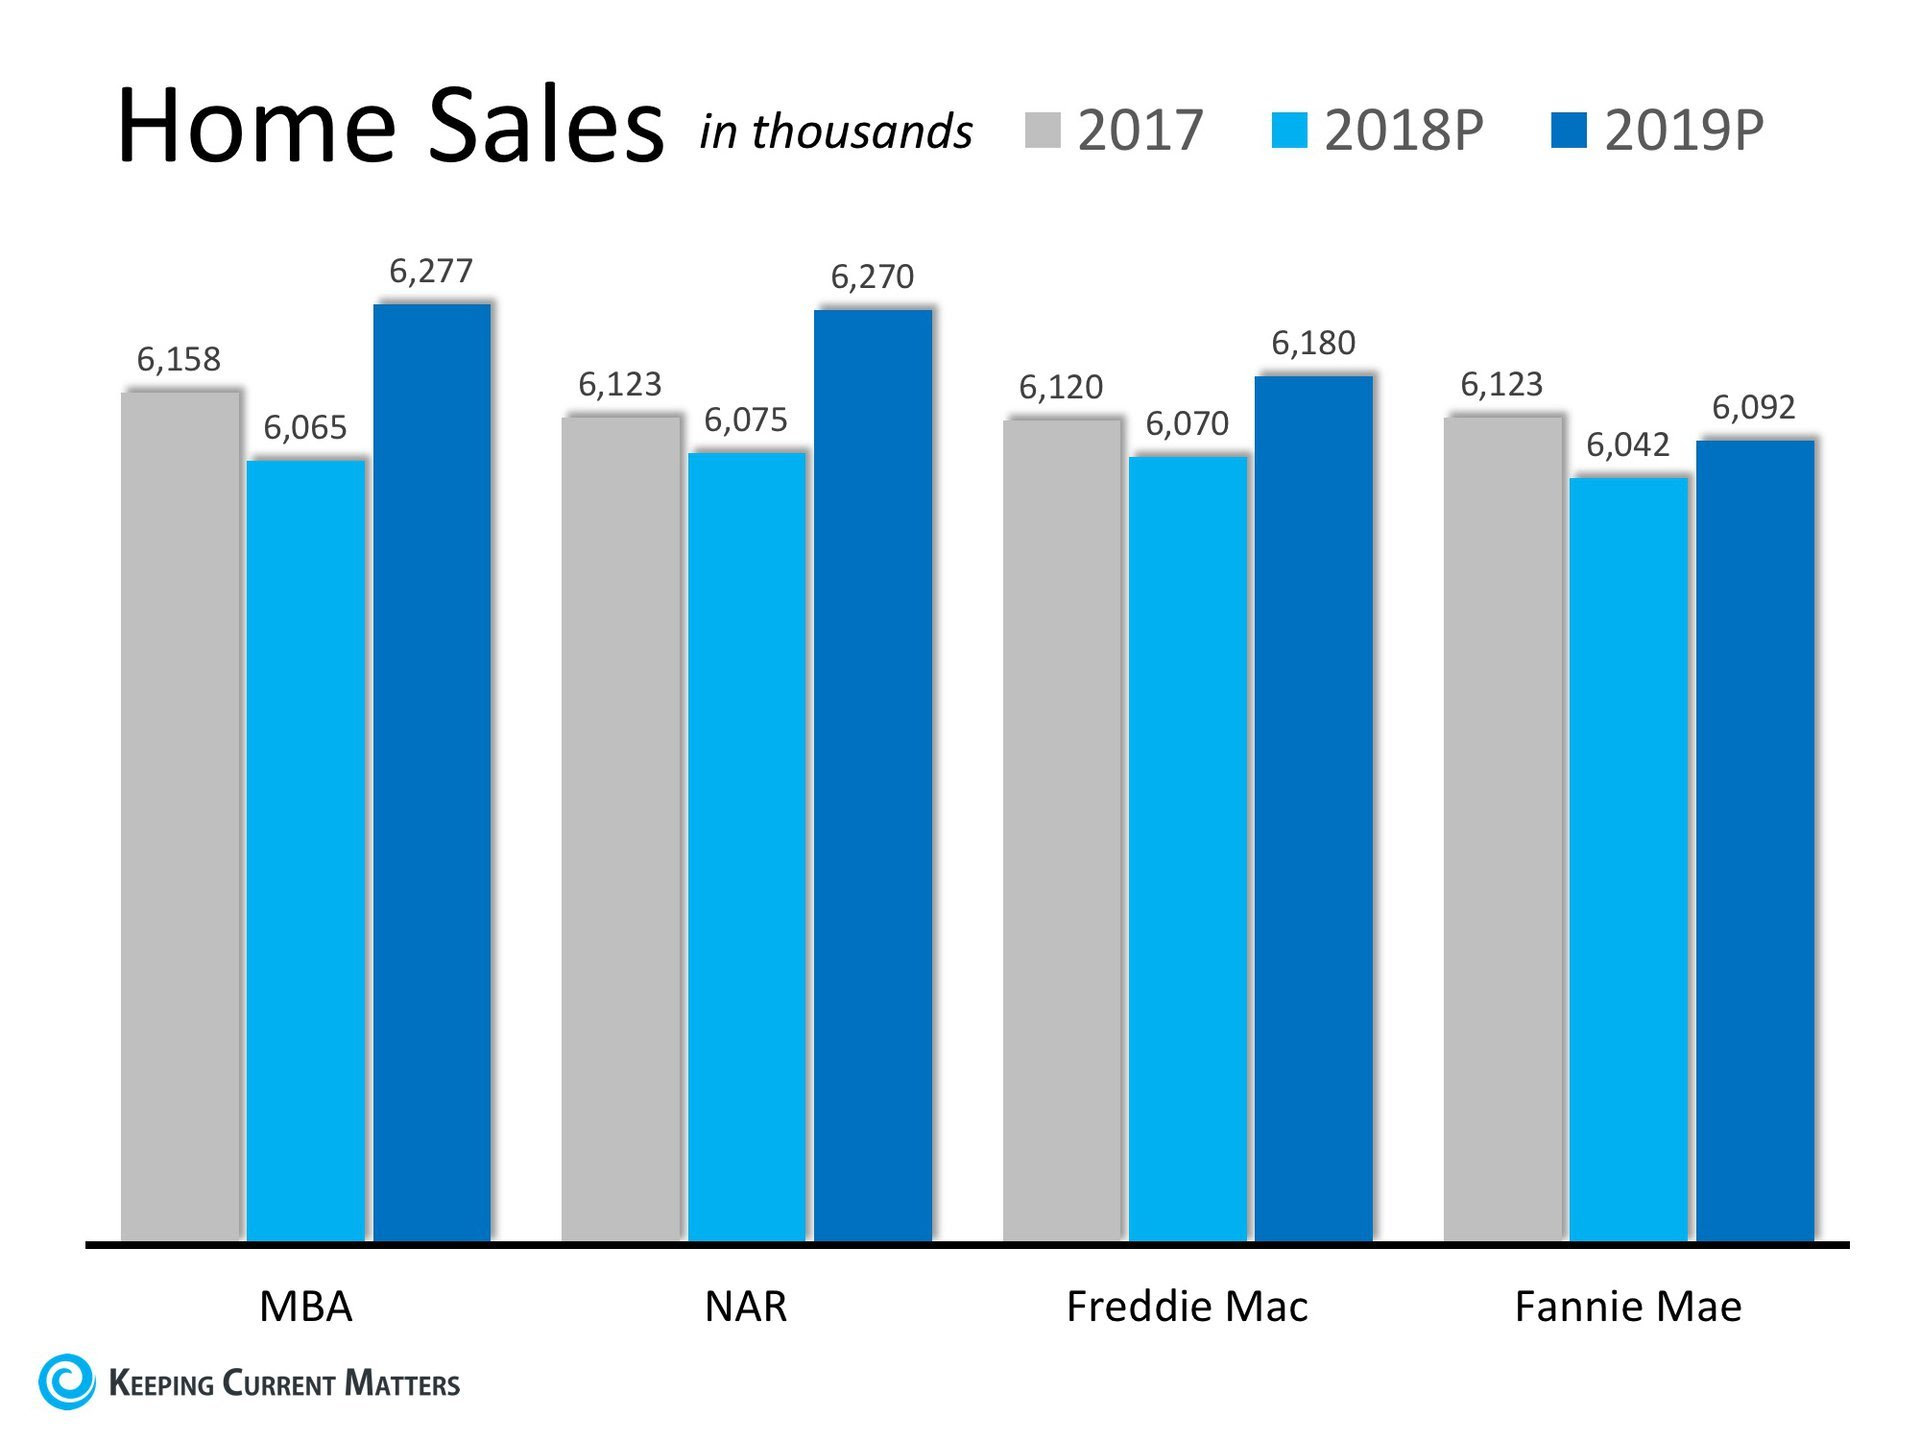
There are many questions about where home sales are headed next year. We have gathered the most reliable sources to help answer this question. Here are our sources:
Mortgage Bankers Association (MBA) – As the leading advocate for the real estate finance industry, the MBA enables members to successfully deliver fair, sustainable, and responsible real estate financing within ever-changing business environments.
The National Association of Realtors (NAR) – The largest association of real estate professionals in the world.
Freddie Mac – An organization which provides liquidity, stability, and affordability to the U.S. housing market in all economic conditions extending to all communities from coast to coast.
Fannie Mae – A leading source of financing for mortgage lenders, providing access to affordable mortgage financing in all markets.
Here are their projections:
Bottom Line
Every source sees home sales growing next year. For more on your neighborhood, contact a local real estate professional.
Monday, November 19, 2018
Is the Increase in Inventory a Bullish or Bearish Sign for Real Estate?

In a recent article, National Housing Inventory Crisis Reaches Inflection Point, realtor.com reported that:
- New listings jumped 8% year-over-year nationally, the largest increase since 2013
- Total listings in the 45 largest markets are now up 6% on average over last year
This increase in housing inventory has sparked two different reactions. Some are saying this is the first sign of a potential collapse while others are saying it is a welcomed reprieve from the lack of inventory that has stalled the market recently. As Zelman & Associatesreported in a recent ‘Z Report’:
“With the rate of home price appreciation starting to decelerate alongside the uptick in inventory, we expect significant debate whether this is a bullish or bearish sign.”
Is this a sign the market might crash?
There are those who look at the increase in inventory as a sign that we are returning to the market we saw last decade. However, a closer look shows that we are nowhere near the levels of inventory we reached before the crash in 2008.
A normal market would have about 6-months inventory, but the latest Existing Home Sales Report issued by the National Association of Realtors revealed that:
“Unsold inventory is at a 4.3-month supply at the current sales pace up from 4.1 months a year ago.”
A decade ago, prices began to rapidly depreciate in June 2007. At that time, we had a 9.1-month supply (more than double what it is today) and inventory kept rising until it hit a peak of 11.1 months in April of 2008.
With the current levels of buyer demand, any such increase in months supply is highly unlikely. As Danielle Hale, realtor.com’s Chief Economist explains:
“After years of record-breaking inventory declines, September’s almost flat inventory signals a big change in the real estate market. Would-be buyers who had been waiting for a bigger selection of homes for sale may finally see more listings materialize. But don’t expect the level to jump dramatically.
Plenty of buyers in the market are scooping up homes as soon as they’re listed, which will keep national increases relatively small for the time being.”
What will be the result of the increase in inventory?
The increase in inventory will allow many families who had been unable to find a home to finally become homeowners. Again, we quote from the ‘Z Report’:
“In our view, the short-term narrative will probably be confusing, but more sustainable growth and affordability will likely be the end result.”
Bottom Line
If you are either a first-time or second-time buyer who has given up, check with a local real estate professional to see if new listings have come to the market in your area.
Friday, November 16, 2018
Baby Boomers are Downsizing, Are You Ready to Move?

For a while now baby boomers have been blamed for a portion of the housing market’s current lack of housing inventory, but should they really be getting the blame?
Here’s what some of the experts have to say on the subject:
Aaron Terrazas, Senior Economist at Zillow, says that “Boomers are healthier and working longer than previous generations, which means they aren’t yet ready to sell their homes.”
According to a study by Realtor.com, 85% of baby boomers indicated they were not planning to sell their homes.
It is true that baby boomers are healthier and are thus working and living longer, but are they also refusing to sell their homes?
Last month, Trulia looked at the housing situation of seniors (aged 65+) today compared to that of a decade ago. Trulia’s study revealed that:
“Although seniors appear to be delaying downsizing until later in life, as a group, households 65 and over are still downsizing at roughly the same rate as in years past.”
Trulia also explains that,
“5.5% of households 65 and over moved, pretty evenly split between moves to single family (2.7%) and multifamily (2.4%) homes. In 2005, these percentages were virtually the same, with 5.5% of senior households moving, including 2.5% into single family and 2.5% into multifamily homes.”
So, if these percentages are the same, what is the challenge?
Recent reports tell us that the older population grew from 3 million in 1900 to 47.8 million in 2017.
In addition, the Census recently revised the numbers from their National Population Projections:
“The aging of baby boomers means that within just a couple decades, older people are projected to outnumber children for the first time in U.S. history…By 2035, there will be 78.0 million people 65 years and older compared to 76.7 million under the age of 18.”
Bottom Line
If you are a baby boomer who is not sure whether you should downsize or move to a warmer climate (other people are doing it, why not you?), call a local real estate professional who can help you evaluate your options today!
Tuesday, November 13, 2018
Pre-Approval: Your 1st Step in Buying a Home

In many markets across the country, the number of buyers searching for their dream homes outnumbers the number of homes for sale. This has led to a competitive marketplace where buyers often need to stand out. One way to show you are serious about buying your dream home is to get pre-qualified or pre-approved for a mortgage before starting your search.
Even if you are in a market that is not as competitive, understanding your budget will give you the confidence of knowing if your dream home is within your reach.
Freddie Mac lays out the advantages of pre-approval in the ‘My Home’ section of their website:
“It’s highly recommended that you work with your lender to get pre-approved before you begin house hunting. Pre-approval will tell you how much home you can afford and can help you move faster, and with greater confidence, in competitive markets.”
One of the many advantages of working with a local real estate professional is that many have relationships with lenders who will be able to help you through this process. Once you have selected a lender, you will need to fill out their loan application and provide them with important information regarding “your credit, debt, work history, down payment and residential history.”
Freddie Mac describes the ‘4 Cs’ that help determine the amount you will be qualified to borrow:
- Capacity: Your current and future ability to make your payments
- Capital or cash reserves: The money, savings, and investments you have that can be sold quickly for cash
- Collateral: The home, or type of home, that you would like to purchase
- Credit: Your history of paying bills and other debts on time
Getting pre-approved is one of many steps that will show home sellers that you are serious about buying, and it often helps speed up the process once your offer has been accepted.
Bottom Line
Many potential homebuyers overestimate the down payment and credit scores necessary to qualify for a mortgage today. If you are ready and willing to buy, you may be pleasantly surprised at your ability to do so.
Friday, November 9, 2018
Dispelling the Myth About Home Affordability

We have all seen the headlines that report that buying a home is less affordable today than it was at any other time in the last ten years, and those headlines are accurate. But, have you ever wondered why the headlines don’t say the last 25 years, the last 20 years, or even the last 11 years?
The reason is that homes were less affordable 25, 20, or even 11 years ago than they are today.
Obviously, buying a home is more expensive now than during the ten years immediately following one of the worst housing crashes in American history.
Over the past decade, the market was flooded with distressed properties (foreclosures and short sales) that were selling at 10-50% discounts. There were so many distressed properties that the prices of non-distressed properties in the same neighborhoods were lowered and mortgage rates were kept low to help the economy.
Low Prices + Low Mortgage Rates = High Affordability
Prices have since recovered and mortgage rates have increased as the economy has gained strength. This has and will continue to impact housing affordability moving forward.
However, let’s give affordability some historical context. The National Association of Realtors (NAR) issues their Affordability Index each month. According to NAR:
“The Monthly Housing Affordability Index measures whether or not a typical family earns enough income to qualify for a mortgage loan on a typical home at the national and regional levels based on the most recent monthly price and income data.”
NAR’s current index stands at 138.8. The index had been higher each of the last ten years, peaking at 197 in 2012 (the higher the index the more affordable houses are).
But, the average index between 1990 and 2007 was just 123 and there were no years with an index above 133. That means that homes are more affordable today than at any time during the eighteen years between 1990 and 2007.
Bottom Line
With home prices continuing to appreciate and mortgage rates increasing, home affordability will likely continue to slide. However, this does not mean that buying a house is not an attainable goal in most markets as it is less expensive today than during the eighteen-year stretch immediately preceding the housing bubble and crash.
Wednesday, November 7, 2018
New Home Sales Up 12.7% From Last Year

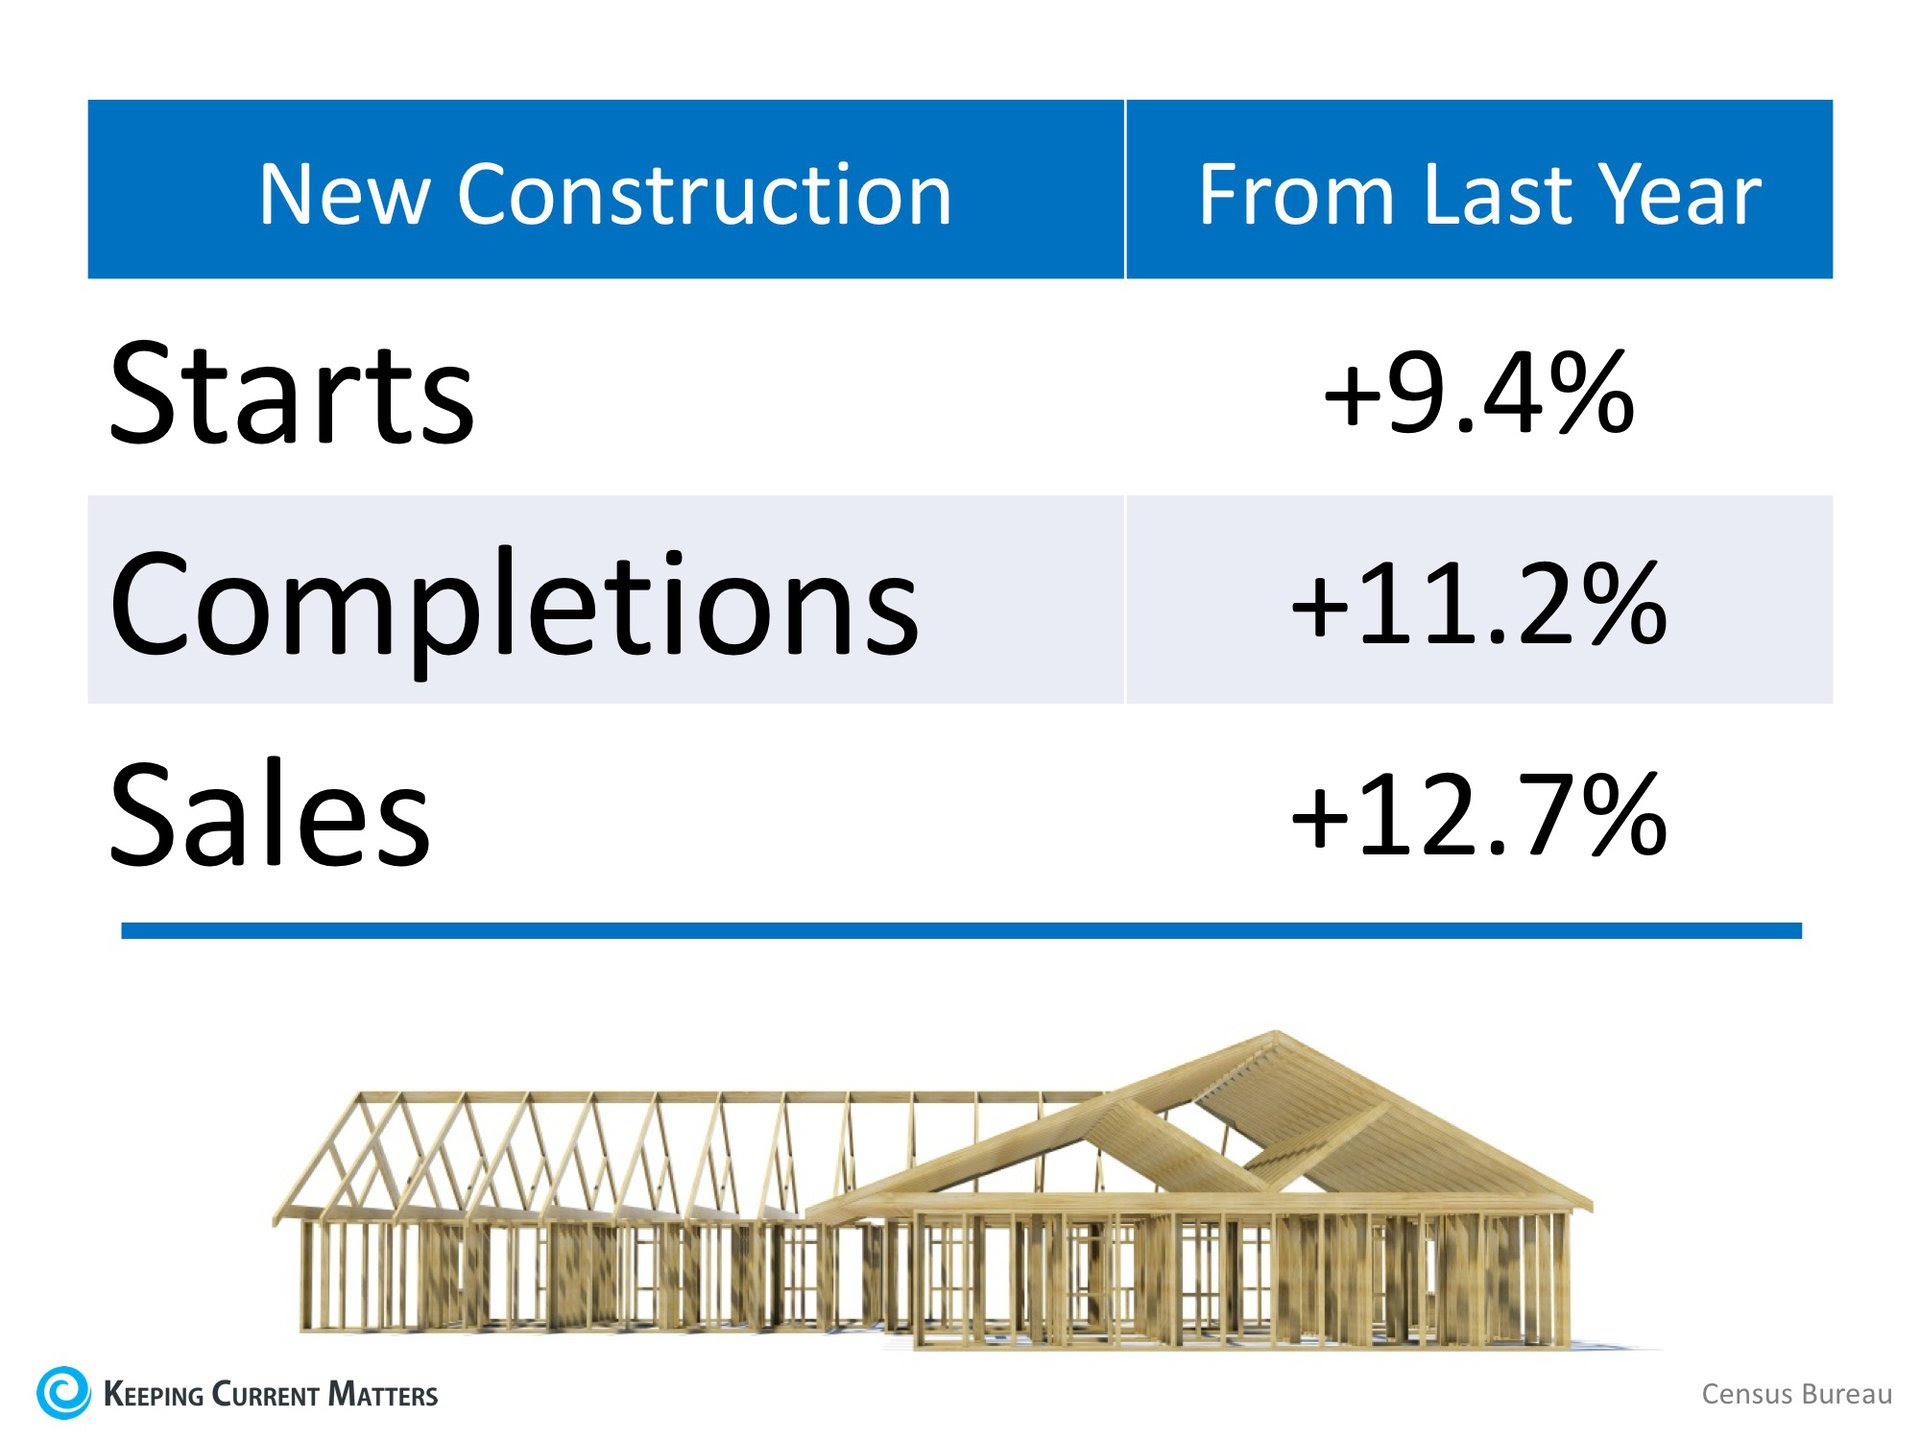
According to the latest New Residential Sales Report from the Census Bureau, new construction sales in August were up 3.5% from July and 12.7% from last year! This marks the second consecutive month with double-digit year-over-year growth (12.8% in July).
The report also showed that builders have ramped up construction with an increase in new construction starts and completions. The summer months are often a busy time for builders as they capitalize on the warmer weather to be able to finish projects.
Below is a table showing the change in starts, completions, and sales from last August.
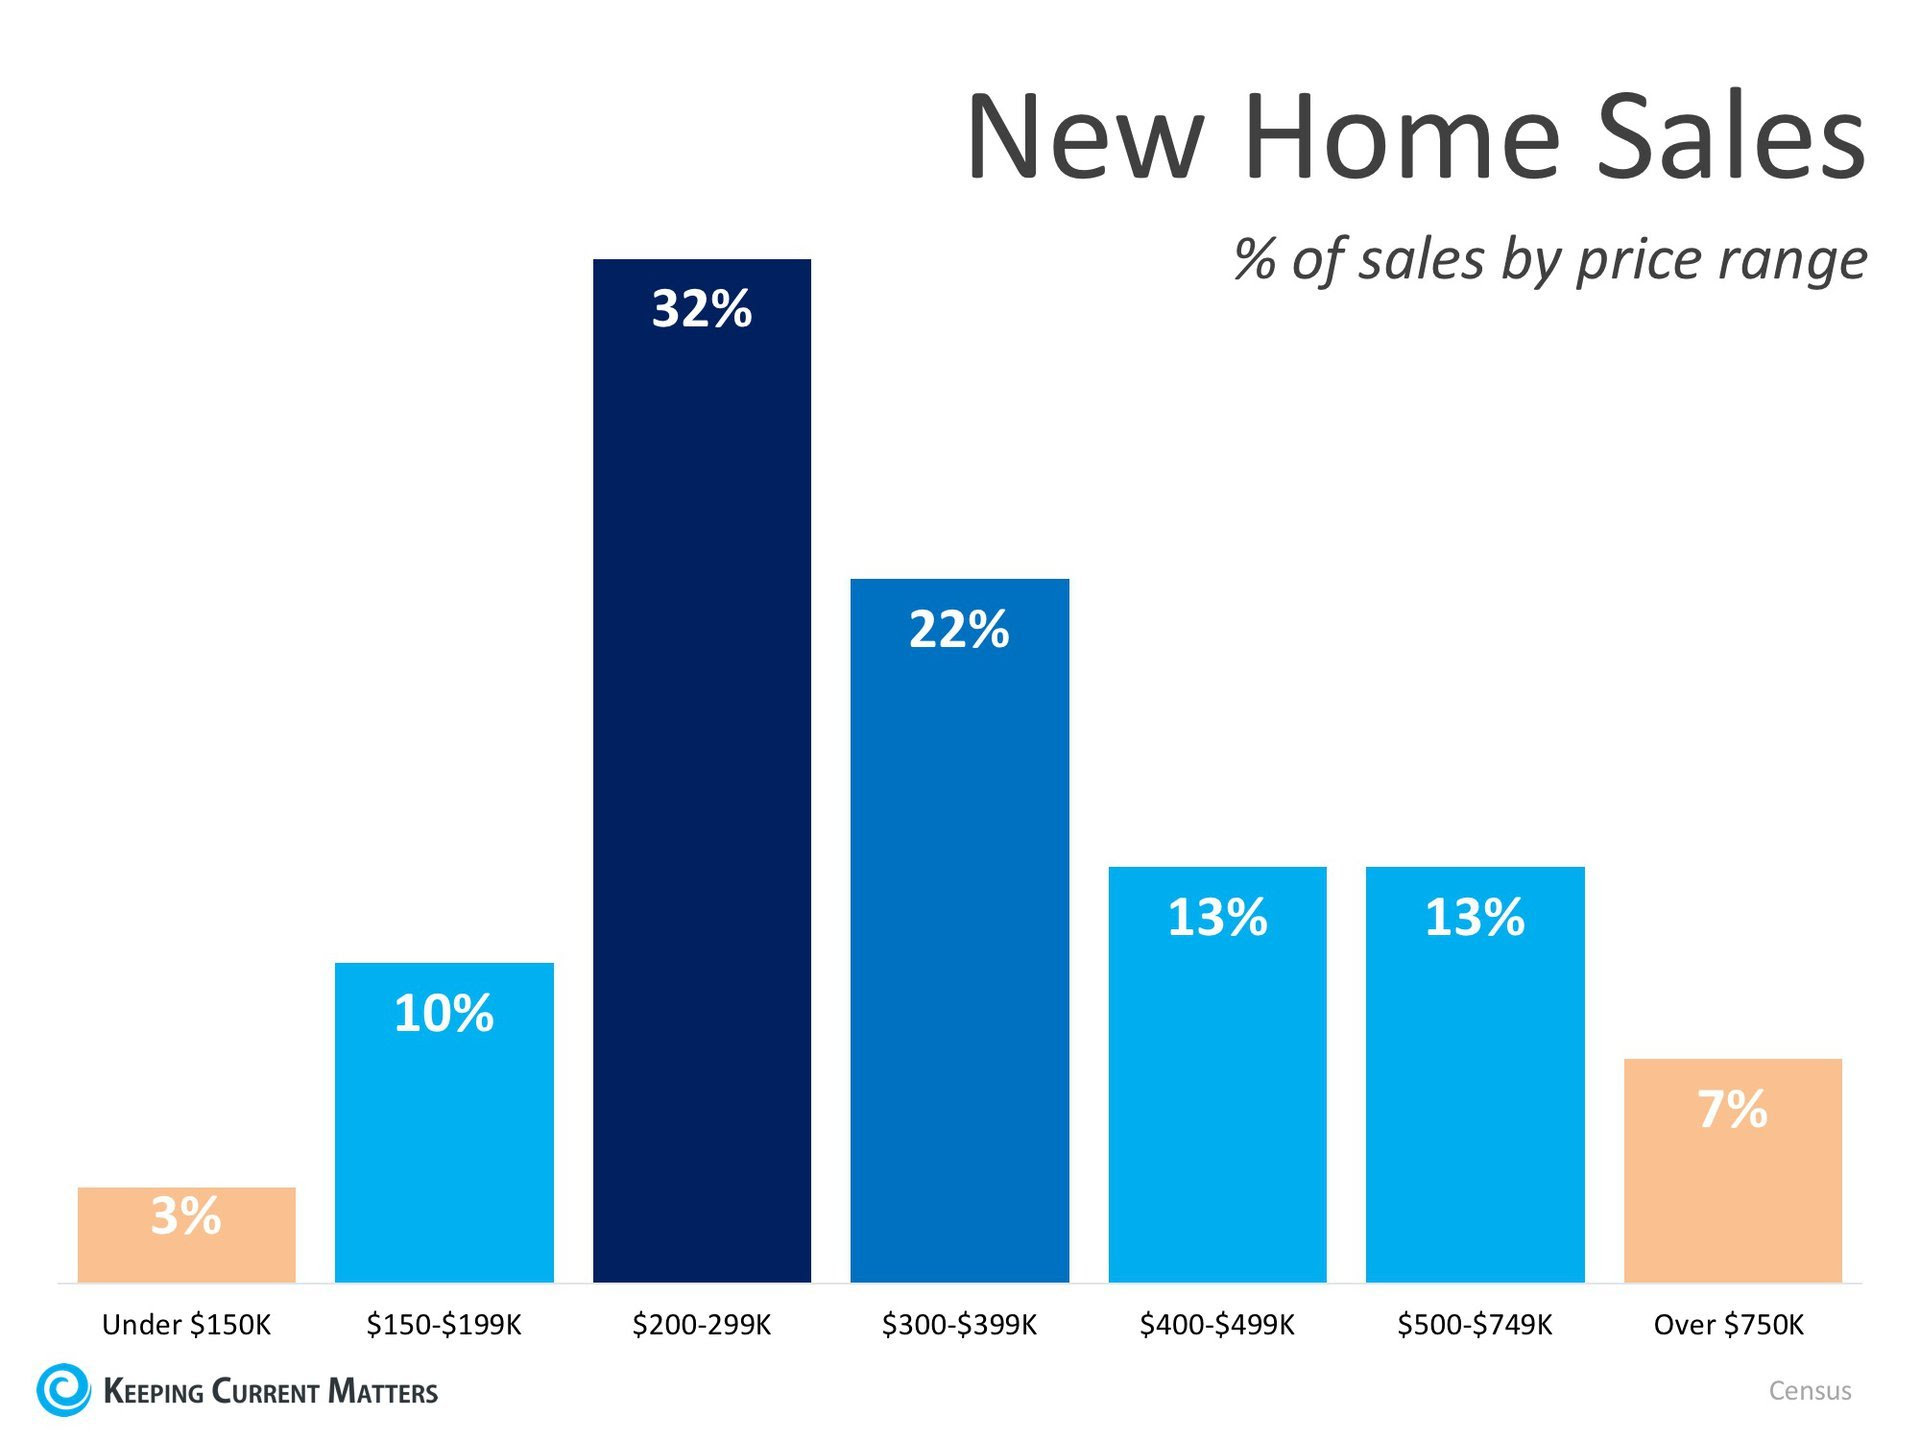
Other notable news from the report is that the percentage of new construction sales in the $200-$299k range has continued to break away from the $300-$399k range.
This shows that builders are starting to build lower-priced homes that will help alleviate some of the inventory challenges in the starter and trade-up home categories. The chart below shows the full breakdown.
What does this mean for buyers and sellers?
If you are thinking of buying or selling in today’s market, you no doubt have heard that there is a shortage of existing homes for sale which has been driving home prices up across the country. The additional new construction coming to the market could help alleviate this shortage, but we are still not back up to pre-crisis levels.
Subscribe to:
Posts (Atom)

