Monday, July 24, 2023


If you’ve been keeping up with the news lately, you’ve probably come across headlines talking about the increase in foreclosures in today’s housing market. This may have left you with some uncertainty, especially if you’re considering buying a home. It’s important to understand the context of these reports to know the truth about what’s happening today.

According to a recent report from ATTOM, a property data provider, foreclosure filings are up 2% compared to the previous quarter and 8% since one year ago. While media headlines are drawing attention to this increase, reporting on just the number could actually generate worry for fear that prices could crash. The reality is, while increasing, the data shows a foreclosure crisis is not where the market is headed.

Let’s look at the latest information with context so we can see how this compares to previous years.

It Isn’t the Dramatic Increase Headlines Would Have You Believe

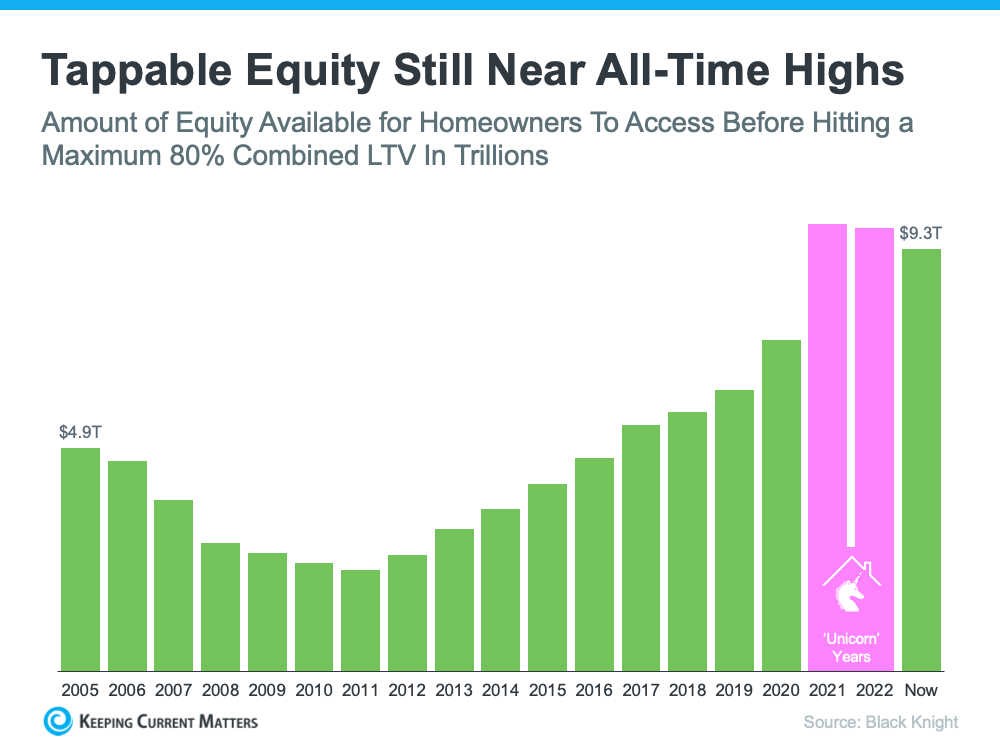
In recent years, the number of foreclosures has been down to record lows. That’s because, in 2020 and 2021, the forbearance program and other relief options for homeowners helped millions of homeowners stay in their homes, allowing them to get back on their feet during a very challenging period. And with home values rising at the same time, many homeowners who may have found themselves facing foreclosure under other circumstances were able to leverage their equity and sell their houses rather than face foreclosure. Moving forward, equity will continue to be a factor that can help keep people from going into foreclosure.

As the government’s moratorium came to an end, there was an expected rise in foreclosures. But just because foreclosures are up doesn’t mean the housing market is in trouble. As Clare Trapasso, Executive News Editor at Realtor.comsays:

Many of these foreclosures would have occurred during the pandemic, but were put off due to federal, state, and local foreclosure moratoriums designed to keep people in their homes . . . Real estate experts have stressed that this isn’t a repeat of the Great Recession. It’s not that scores of homeowners suddenly can’t afford their mortgage payments. Rather, many lenders are now catching up. The foreclosures would have happened during the pandemic if moratoriums hadn’t halted the proceedings.

In a recent article, Bankrate also explains:

“In the years after the housing crash, millions of foreclosures flooded the housing market, depressing prices. That’s not the case now. Most homeowners have a comfortable equity cushion in their homes. Lenders weren’t filing default notices during the height of the pandemic, pushing foreclosures to record lows in 2020. And while there has been a slight uptick in foreclosures since then, it’s nothing like it was.”

Basically, there’s not a sudden flood of foreclosures coming. Instead, some of the increase is due to the delayed activity explained above while more is from economic conditions.

To further paint the picture of just how different the situation is now compared to the housing crash, take a look at the graph below. It uses data on foreclosure filings for the first half of each year since 2008 to show foreclosure activity has been consistently lower since the crash.

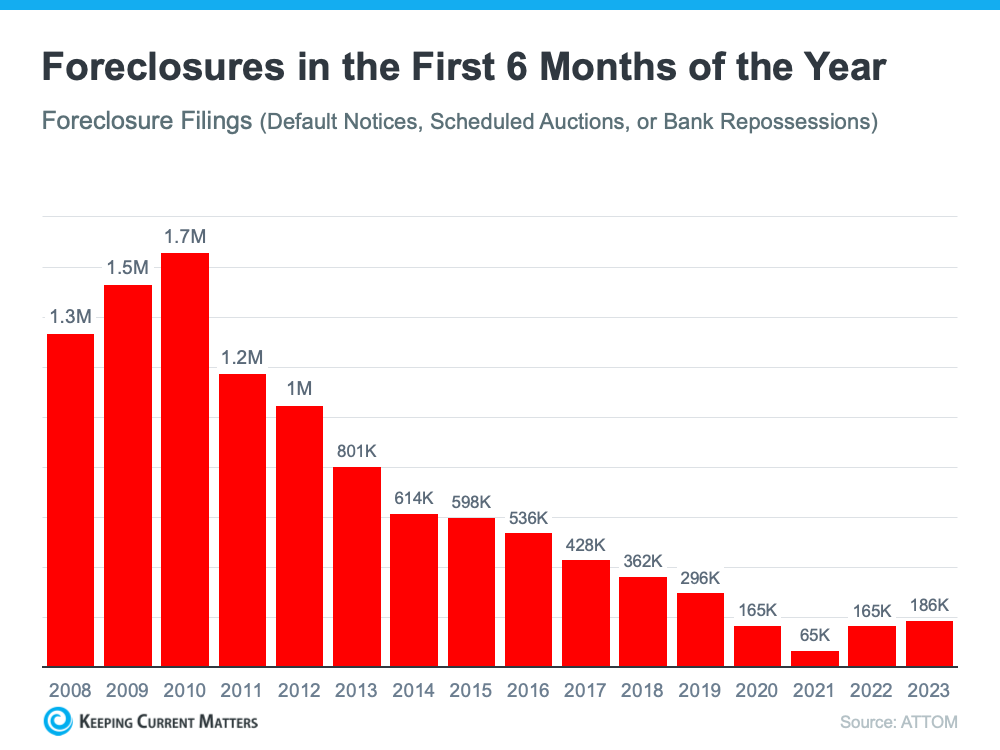
While foreclosures are climbing, it’s clear foreclosure activity now is nothing like it was back then. Today, foreclosures are far below the record-high number that was reported when the housing market crashed.

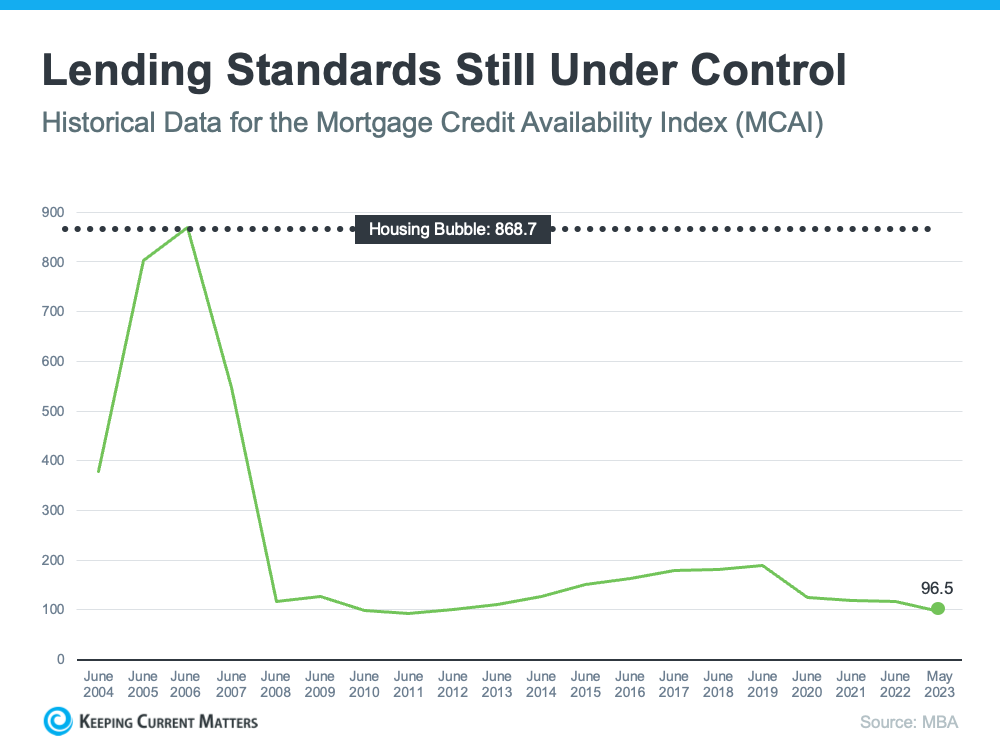
In addition to all the factors mentioned above, that’s also largely because buyers today are more qualified and less likely to default on their loans.

Bottom Line

Right now, putting the data into context is more important than ever. While the housing market is experiencing an expected rise in foreclosures, it’s nowhere near the crisis levels seen when the housing bubble burst, and that won’t lead to a crash in home prices.

Wednesday, July 5, 2023

Lending Standards Are Not Like They Were Leading Up to the Crash


You might be worried we’re heading for a housing crash, but there are many reasons why this housing market isn’t like the one we saw in 2008. One of which is how lending standards are different today. Here’s a look at the data to help prove it. 

Every month, the Mortgage Bankers Association (MBA) releases the Mortgage Credit Availability Index (MCAI). According to their website:

“The MCAI provides the only standardized quantitative index that is solely focused on mortgage credit. The MCAI is . . . a summary measure which indicates the availability of mortgage credit at a point in time.”

Basically, the index determines how easy it is to get a mortgage. Take a look at the graph below of the MCAI since they started keeping track of this data in 2004. It shows how lending standards have changed over time. It works like this: 

  • When lending standards are less strict, it’s easier to get a mortgage, and the index (the green line in the graph) is higher.
  • When lending standards are stricter, it’s harder to get a mortgage, and the line representing the index is lower.

In 2004, the index was around 400. But, by 2006, it had gone up to over 850. Today, the story is quite different. Since the crash, the index went down because lending standards got tighter, so today it’s harder to get a mortgage.

Loose Lending Standards Contributed to the Housing Bubble

One of the main factors that contributed to the housing bubble was that lending standards were a lot less strict back then. Realtor.com explains it like this: 

“In the early 2000s, it wasn’t exactly hard to snag a home mortgage. . . . plenty of mortgages were doled out to people who lied about their incomes and employment, and couldn’t actually afford homeownership.” 

The tall peak in the graph above indicates that leading up to the housing crisis, it was much easier to get credit, and the requirements for getting a loan were far from strict. Back then, credit was widely available, and the threshold for qualifying for a loan was low.

Lenders were approving loans without always going through a verification process to confirm if the borrower would likely be able to repay the loan. That means creditors were lending to more borrowers who had a higher risk of defaulting on their loans.

Today’s Loans Are Much Tougher To Get than Before

As mentioned, lending standards have changed a lot since then. Bankrate describes the difference: 

“Today, lenders impose tough standards on borrowers – and those who are getting a mortgage overwhelmingly have excellent credit.”

If you look back at the graph, you’ll notice after the peak around the time of the housing crash, the line representing the index went down dramatically and has stayed low since. In fact, the line is far below where standards were even in 2004 – and it’s getting lower. Joel Kan, VP and Deputy Chief Economist at MBA, provides the most recent update from May:

“Mortgage credit availability decreased for the third consecutive month . . . With the decline in availability, the MCAI is now at its lowest level since January 2013.”

The decreasing index suggests standards are getting much tougher – which makes it clear we’re far away from the extreme lending practices that contributed to the crash.

Bottom Line

Leading up to the housing crash, lending standards were much more relaxed with little evaluation done to measure a borrower’s potential to repay their loan. Today, standards are tighter, and the risk is reduced for both lenders and borrowers. This goes to show, these are two very different housing markets, and this market isn’t like the last time.

Monday, July 3, 2023

A Drop in Equity Doesn’t Mean Low Equity


You may see media coverage talking about a drop in homeowner equity. What’s important to understand is that equity is tied closely to home values. So, when home prices appreciate, you can expect equity to grow. And when home prices decline, equity does too. Here’s how this has played out recently. 

Home prices rose rapidly during the ‘unicorn’ years. That gave homeowners a considerable equity boost. But those ‘unicorn’ years couldn’t last forever. The market had to moderate at some point, and that’s what we saw last fall and winter. 

As home prices dropped slightly in the back half of 2022, equity was impacted. Based on the most recent report from CoreLogic, there was a 0.7% dip in homeowner equity over the last year. However, the headlines reporting on that change aren’t painting the whole picture. The reality is, while home price depreciation during the second half of last year caused equity to drop, the data shows homeowners still have near record amounts of equity

The graph below helps illustrate this point by looking at the total amount of tappable equity in this country going all the way back to 2005. Tappable equity is the amount of equity available for homeowners to access before hitting a maximum 80% loan-to-value ratio (LTV). As the data shows, there was a significant equity boost during the ‘unicorn’ years as home prices rapidly appreciated (see the pink in the graph below).

But here’s what’s key to realize – even though there’s been a small dip, total homeowner equity is still much higher than it was before the ‘unicorn’ years.

And there’s more good news. Recent home price reports show the worst home price declines are behind us, and prices have started to go up again. As Selma Hepp, Chief Economist at CoreLogicexplains:

“Home equity trends closely follow home price changes. As a result, while the average amount of equity declined from a year ago, it increased from the fourth quarter of 2022, as monthly home prices growth accelerated in early 2023.” 

The last part of that quote is particularly important and is the piece of the puzzle the news is leaving out. To further emphasize the positive turn we’re already seeing, experts say home prices are forecast to appreciate at a more normal rate over the next year. In the same report, Hepp puts it this way:

The average U.S. homeowner now has more than $274,000 in equity – up significantly from $182,000 before the pandemic. Also, while homeowners in some areas of the country who bought a property last spring have no equity as a result of price losses, forecasted home price appreciation over the next year should help many borrowers regain some of that lost equity.”

And even though Odeta Kushi, Deputy Chief Economist at First American, references a slightly different number, Kushi further validates the fact that homeowners have a lot of equity right now: 

“Homeowners today have an average of $302,000 in equity in their homes.”

That means if you’ve owned your home for a few years, you likely still have way more equity than you did before the ‘unicorn’ years. And if you’ve owned your home for a year or less, the forecast for more typical price appreciation over the next year should mean your equity is already on the way back up.

Bottom Line

Context is everything when looking at headlines. While homeowner equity dropped some from last year, it’s still near all-time highs. Reach out to a trusted real estate professional so you can get the answers you deserve from an expert who’s there to help as you plan your move this year.